SEO in the age of AI
with BigQuery and Experimentation
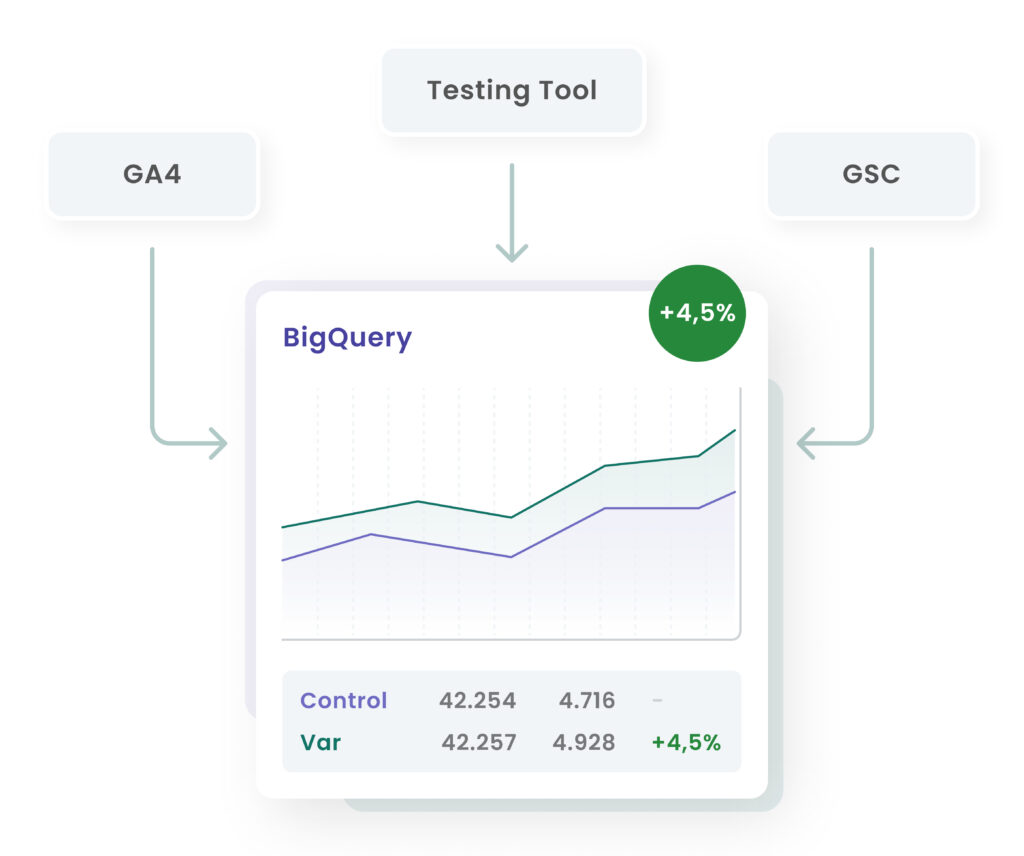
- GSC and GA4 combined in BigQuery: full view from query to conversion.
- SEO prioritized by business value and optimized via A/B tests.
- Focus on conversions instead of mere visibility - also with AI overviews.
Practical tips for beginners
Getting started with a relatively complex query like this can feel like a big leap, but you don't have to be an SQL expert to benefit from it. Here are a few tips to get you started:
First define your variables: In the first lines of the query, variables for your start and end date (start_date, end_date) and your experiment variant strings (variant_a, variant_b) are defined. Change these at the top of the script to customize them to your specific test. Here you can easily customize the analysis. This is a best practice that makes the query reusable and reduces the risk of errors.
Just get started: Do not try to understand every line of code at once. The query consists of several sub-queries (the WITH clauses). Each of these is a small, manageable piece of the puzzle. First execute only the gsc_data part to see the output, then the variant_data part and so on. This step-by-step approach will help you build your understanding gradually.
Concentrate on the links: The most important part of the entire script is the way in which the different parts are linked together. Note the LEFT JOIN statements in the user_level_data section. This is crucial as it ensures that we keep all our variant users, even those that are not converted. An INNER JOIN would remove users without a purchase, which would result in a skewed conversion rate. The LEFT JOIN preserves the full test group, which is essential for accurate A/B test analysis.
Read the comments: The comments (marked with -) in the query are intended to help you. They explain what each section of the code does. Read them carefully, they are your guide through the logic of the script.
Use the final output: The final output of the script is a table with two main parts: query_level_results and overall_results. The first table shows you how each variant performed for specific search queries, and the second gives you a general summary. Here you will find the answers to your key questions: "Where is it going well?", "Where is it going badly?" and "Where is there untapped potential?".
This script is more than just a reporting tool. It's a foundational framework to help you move from analysis to confident action. It gives you the precise data you need to identify problems, formulate hypotheses and test them with scientific rigor.
Breakdown of the query
A script like this may seem intimidating at first glance, but it is based on a simple principle: we connect different information tables using a unique user ID. The entire query is built using a series of Common Table Expressions (CTEs), the parts that start with WITH. Think of each WITH statement as a self-contained, logical step in our data processing. It's like building with LEGO bricks: you start by creating a few simple blocks and then assemble them into a complete model.
Let's take a closer look at the individual "building blocks":
gsc_data: This is our starting point. We instruct BigQuery to call up our Search Console table and retrieve all the data for a specific time period. This aggregates impressions, clicks and pages to give us a baseline for our organic performance.
variant_data: Here we retrieve data directly from our GA4 events. Specifically, we are looking for the custom event that logs which experiment variant (A or B) a user was exposed to. This establishes the important link between a user and the test they participated in.
organic_users: This part of the query identifies all users who have come to our website via an organic Google search. It helps us to filter our data to ensure that we only analyze the users that are relevant to our SEO-related experiment.
user_purchases & user_add_to_cart: Here we get the conversion data (note: the example uses e-commerce KPIs, but these can very well be replaced by lead gen conversions). We ask BigQuery to find all purchase and add_to_cart events and link them to our users. We not only look at the number of conversions, but also other valuable metrics such as total revenue.
By the time we get to the user_level_data and query_level_results sections, we have already done all the hard work. The script then merges all these smaller data sets using the unique user_pseudo_id and finally aggregates all the data to provide a clear, easy to read output. This is the core logic that transforms your isolated data into a unified model so you can answer questions like: "Did the new page content increase mobile conversions for high-frequency long-tail keywords?"

Questions about the script?
The author, Bas Linders, is happy to exchange ideas and is available for questions or suggestions for improvement.
The SQL script provided serves as a helpful tool to optimize the connection between GSC, GA4 and BigQuery. We have provided tips and examples for use in the article, but the responsibility for the application and any effects, such as exceeding BigQuery limits, lies with the user.