Audience-based evaluation in GA4
Table of contents
In short
Audiences can be used as a comparison option for GA4 standard reports. It is also possible to use it to monitor real-time data. You also have the option of creating your own reports, e.g. using our A/B testing report template.
Step-by-Step Tutorial
Audience-based evaluation in GA4
Creating audience comparisons
Before you Real-time data or other Standard reports with the help of audiences, it is necessary that you first create one or more comparisons.
In the navigation bar on the left, switch to the area: Reports
- Click above your reports at the height of the date line on Add comparison
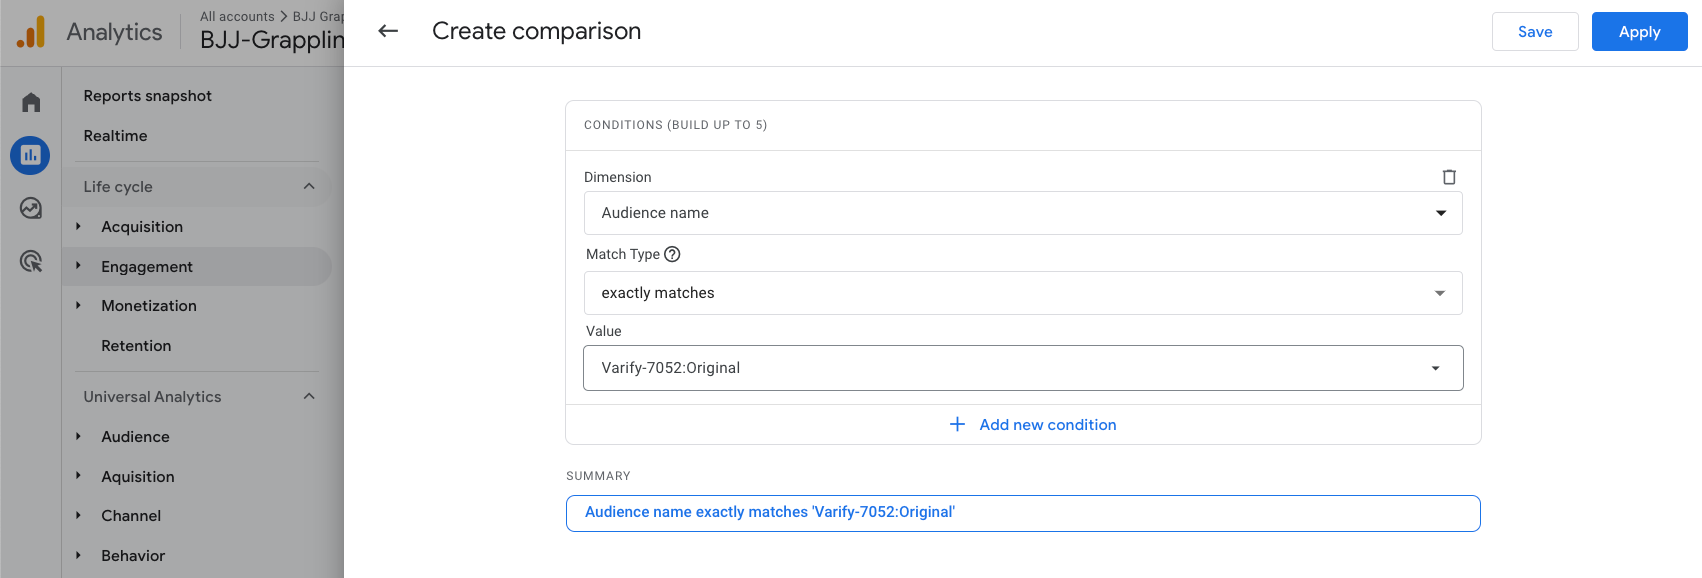
- Click on "Add new"
- Select the "Dimension" Audience name from
- Select at "Match Type" exactly matches
- Select the name of your target group under "Value". Your audiences will also be suggested directly.
- If you use the Varify.io® internal GA4 reporting, the audience was created automatically.
- The audience name is always created according to the following scheme: Varify-{Experiment-ID}:{Variation-ID} - for example: Varify-7826:9456
- You can also use this method to evaluate your own created audiences.
- Then click on "Apply"
- You can now add further audiences as a comparison if you wish. Proceed exactly as described above.
How to use audience comparisons
Evaluation of experiment real-time data with the help of audiences in GA4
Would you like to check whether the data from your experiments and variants is being tracked in real time in GA4? Then use the Comparisons function in the Reports section with the help of Audiences.
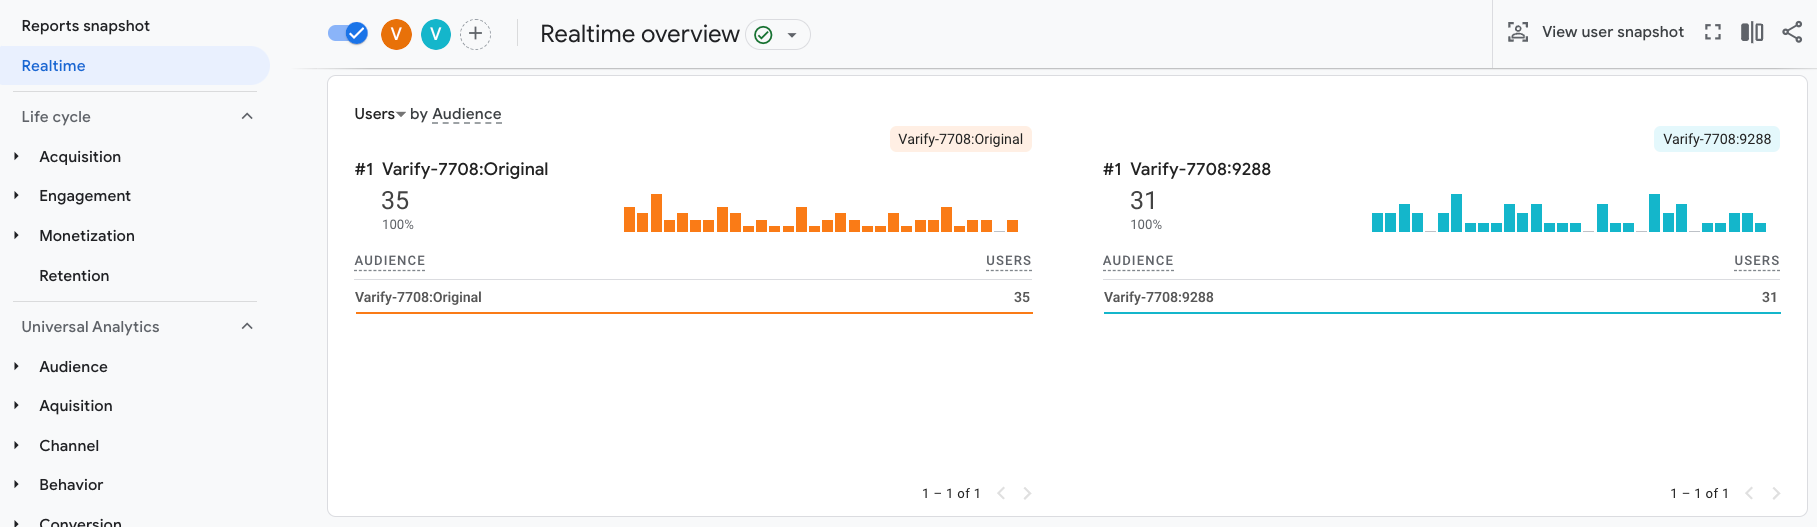
Switch to the area: Real-time data
- Create the audiences for comparison as shown above
- Make sure that the comparison is activated via the toggle switch
- Now you should see whether test participants are already being tracked in your audiences
- The display of tracking can take several minutes after setting up an audience
Evaluation of standard reports with the help of audiences in GA4
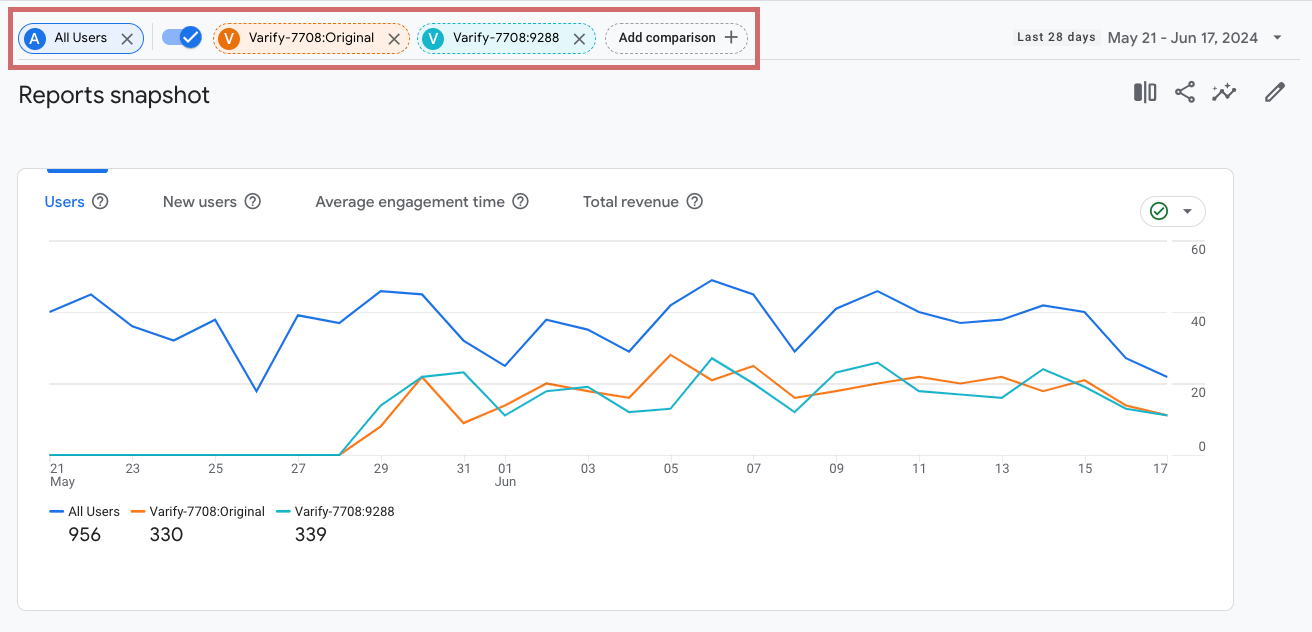
Use Audiences to compare the variants of your A/B tests with each other in your GA4 standard reports. After you have created the comparisons, you can open all your standard reports under the Reports section and compare your A/B test results with each other.
You can also use the audience comparison in standard reports that you create yourself. We have created an A/B test report for you, which you can activate with just a few clicks.
Varify A/B Test Standard Report
We have created a standard A/B test report for you, which you can integrate into your GA4 with just a few clicks. You can use this report to easily compare your variants with each other via the experiment ID and view the most important key figures.
In addition to the typical GA4 metrics, you can also use this report to display and evaluate individual/user-defined events
1. create reports via URL
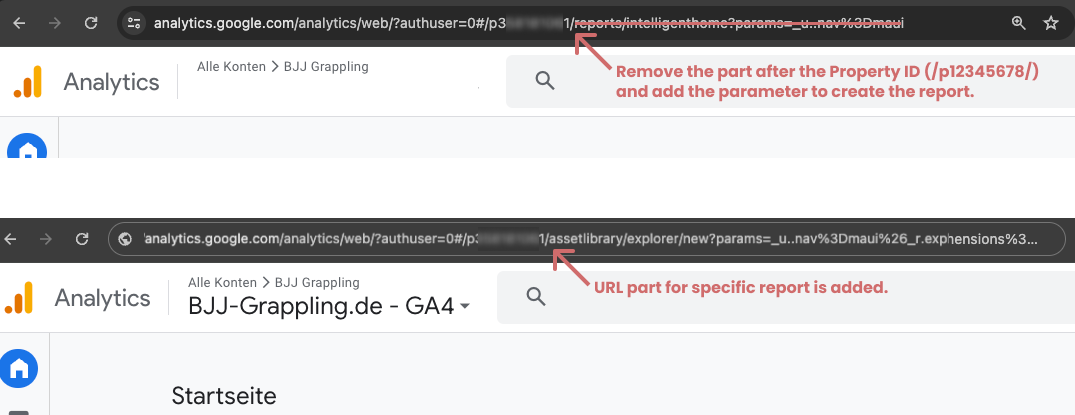
By adding the URL in the right place, the desired report can be created directly. To do this, add the part for report creation after the property ID in the URL of the Google Analytics 4 dashboard
- Remove the URL part after the property ID in the URL (after /p12345678/).
- Complete the URL part that we provide here.
- Save the called report -> Vairfy A/B Testing Report
assetlibrary/explorer/new?params=_u..nav%3Dmaui%26_r.explorerCard..dimensions%3D%5B%22audienceName%22%5D%26_r.explorerCard..seldim%3D%5B%22audienceName%22%5D%26_r.explorerCard..metrics%3D%5B%22totalUsers%22,%22checkouts%22,%22purchases%22,%22conversions%22,%22userConversionRate%22,%22eventCount%22%5D%26_r.explorerCard..selmet%3D%5B%22totalUsers%22,%22checkouts%22%5D%26_r.explorerCard..sortKey%3DtotalUsers%26_r.explorerCard..isAscending%3Dfalse&r=new-report
After you have loaded the page with the supplemented URL part, a report opens which you can edit. Here you do not have to do anything other than click on "Save".
2. publish the report in a collection
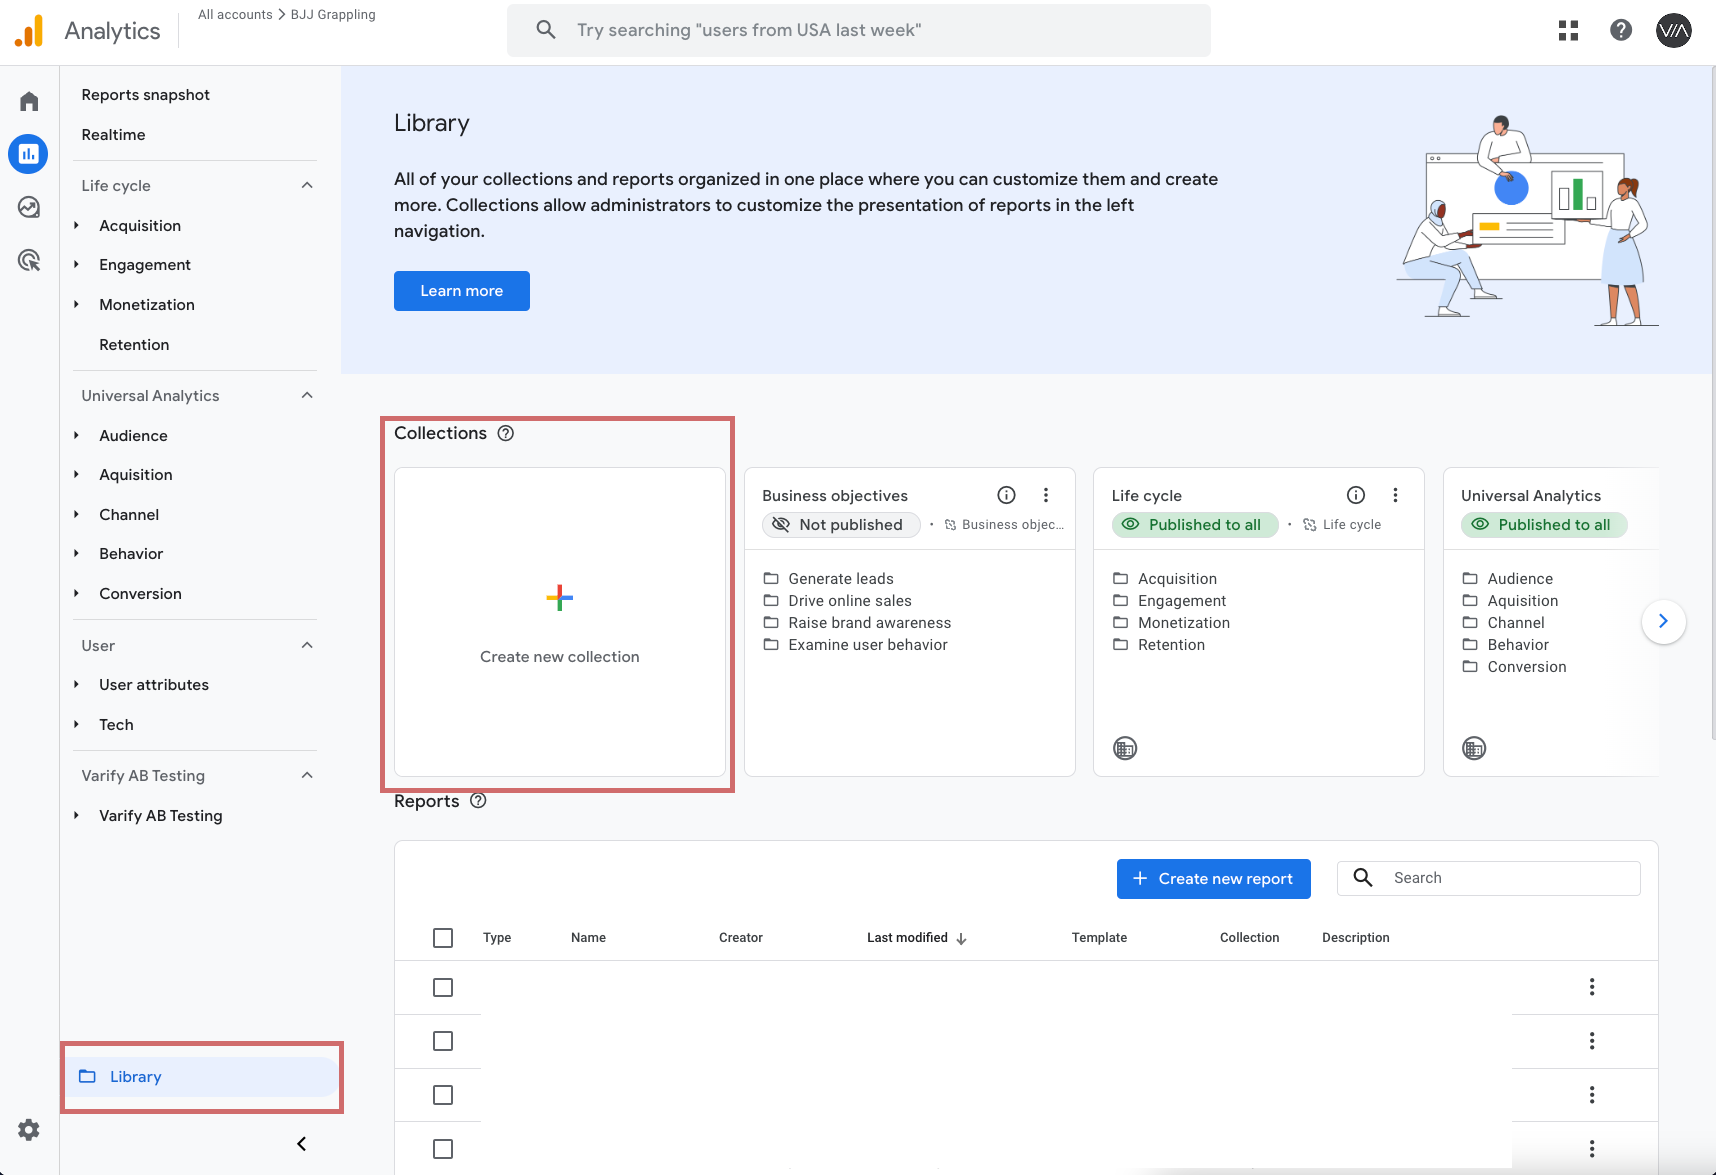
After you have saved the report, you can add it to an existing report collection in the report library, or you can create your own collection for A/B testing reports.
- Go to your report library
- Click on "Create new collection" and create an empty collection
- Name the collection "A/B Testing"
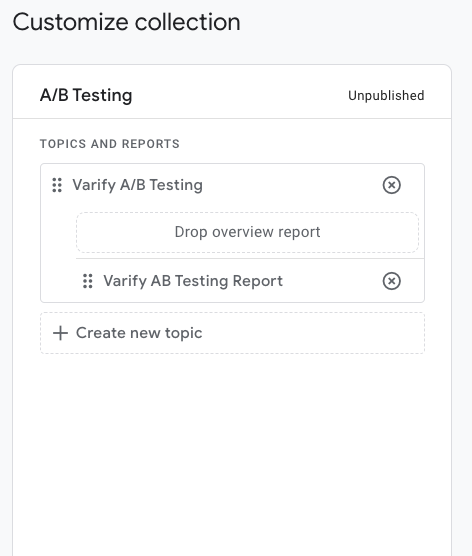
- Create a new section heading "Varify A/B Testing"
- Drag your created report into the
- Save the collection
- Now publish the collection in the library (click on the three dots next to the collection and select "Publish")
3. evaluate the experiment in the report
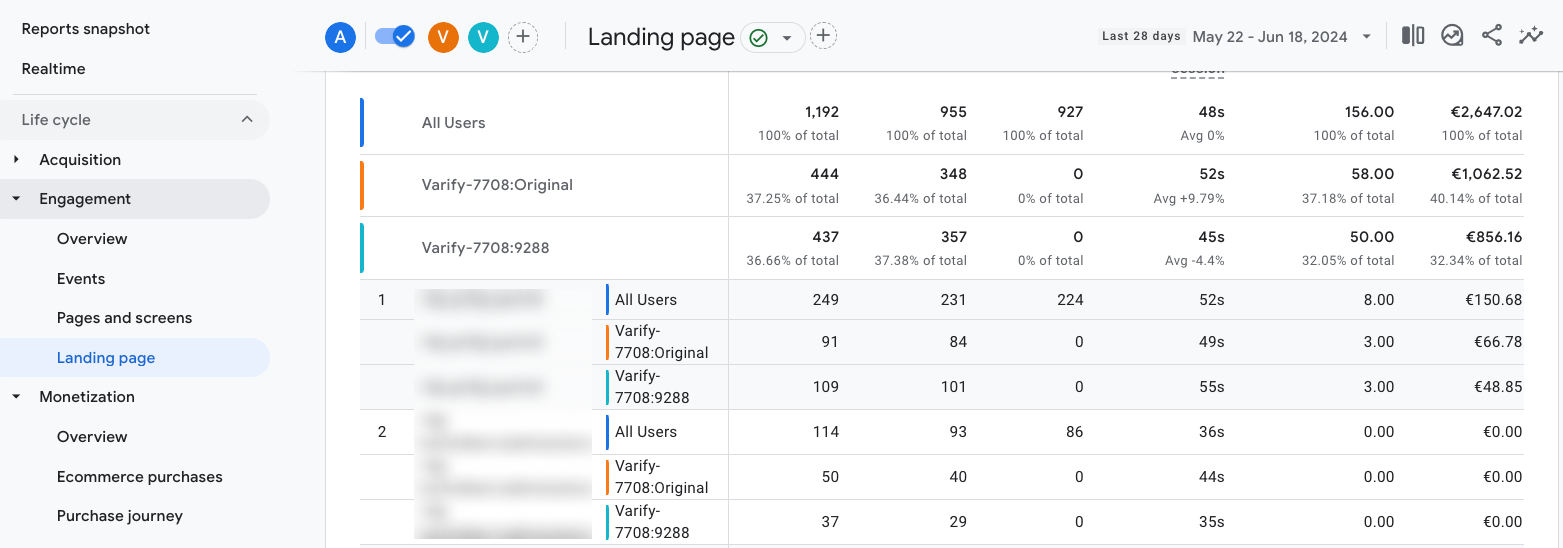
Once you have published the report collection, it will appear in the standard reports column. Go to the newly created report here.
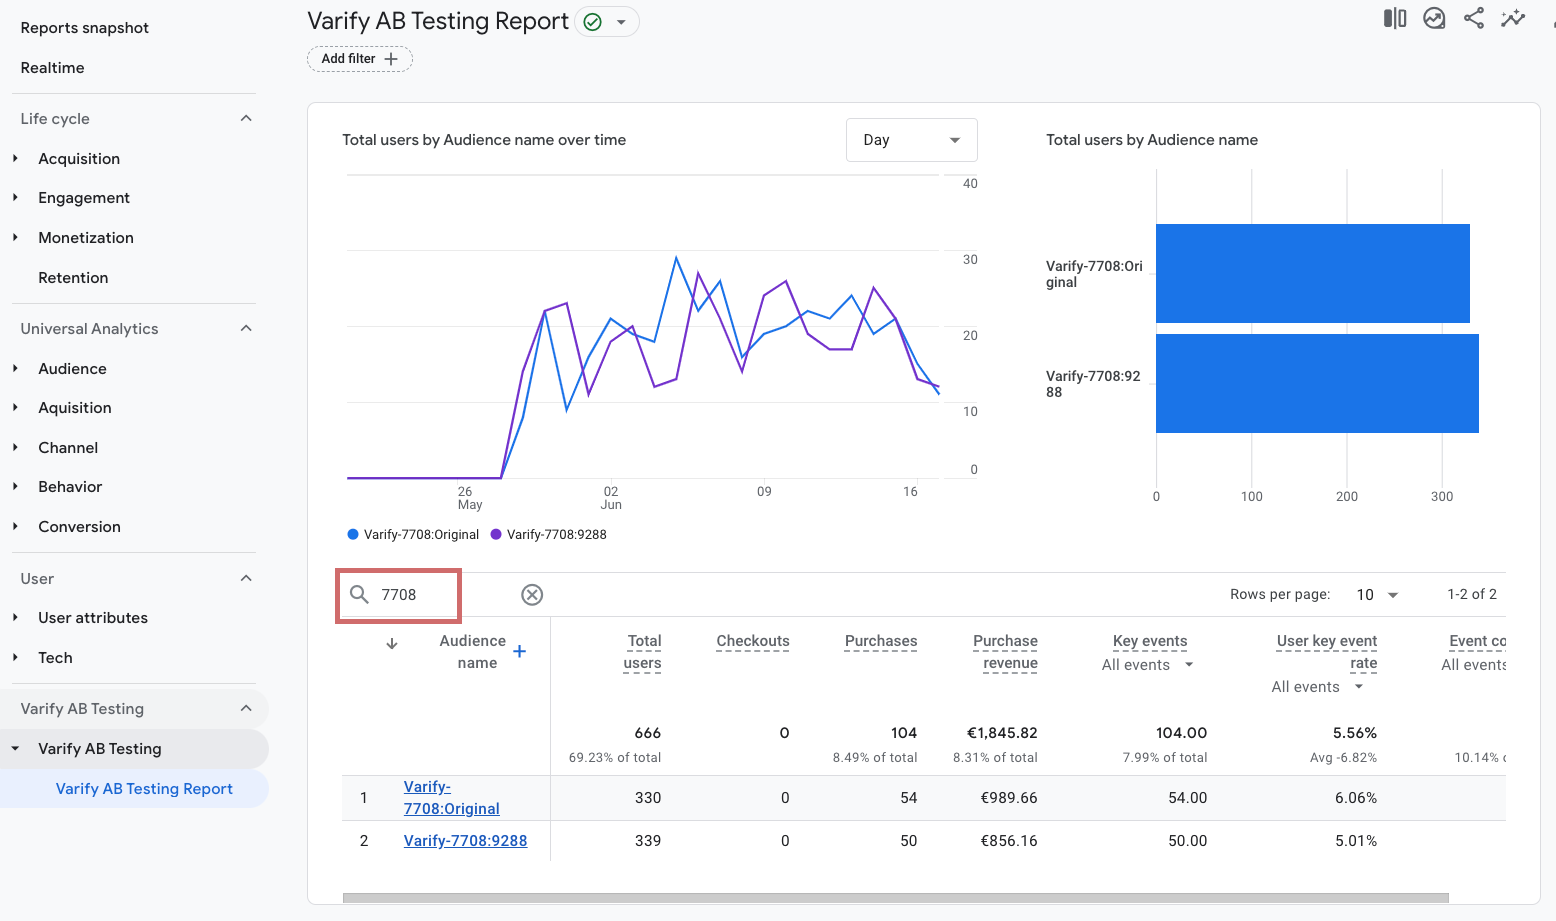
To evaluate an experiment, you can now simply enter the experiment ID in the search field for the audience name. All variants, including the original of the corresponding experiment, are then displayed.
4. customize report individually
You can easily customize the created report according to your wishes. Simply click on the pencil icon. The menu for editing will then open.
Under "Metrics" you can add further metrics or remove metrics that have already been added. Then save the changes.
5. display user-defined events
If you want to evaluate user-defined events, you can easily do this via the Varify report. If your metric is stored as a user-defined metric, you can simply add it as a metric as described in point 4.
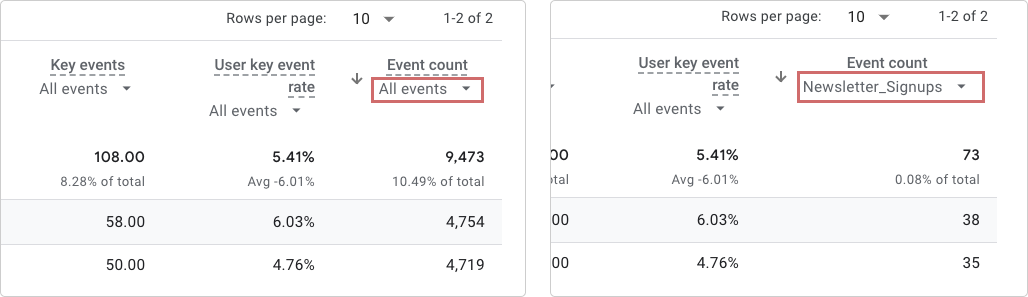
If your event is not created as a user-defined metric, you can use the "Event Count" metric in the report to display a specific event. By default, all events are displayed here.
- Click on the dropdown under "Event Count"
- Then select the desired event in the window that opens
- Event Count now only shows the numbers for the selected event
The same works for the "Key events" metric. Here, too, all key events are displayed by default. If you only want to see a specific one, you can also select it individually.