Segment and filter reports
Table of contents
In short
Varify.io provides you with a wide range of filter and segmentation options for reporting. In reporting, you can segment directly by device category and user type.
In addition, the GA4 connection settings offer you further filter options.
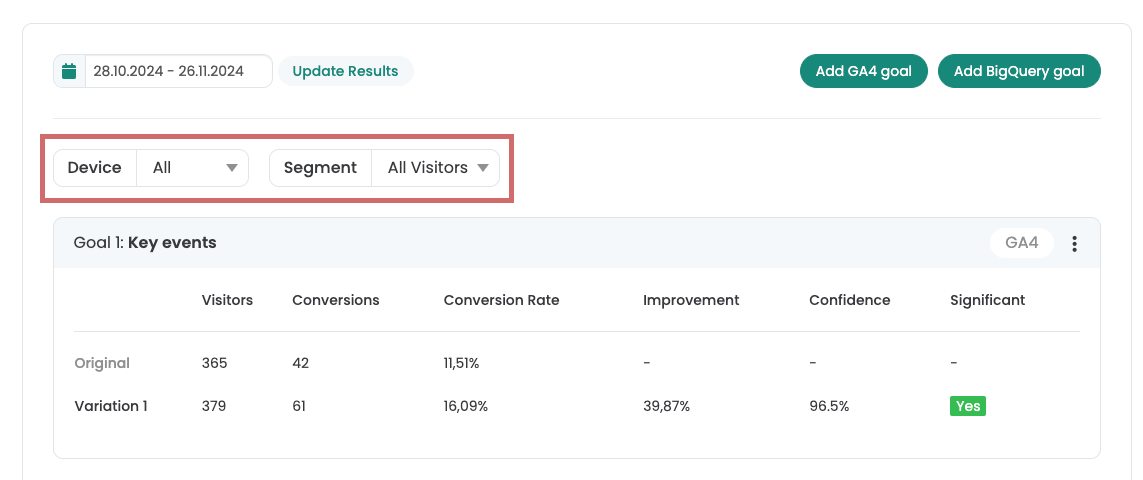
Segmentations
In Varify.io, you can segment your reports directly in the reporting area. Simply select the desired segmentation from the drop-down menu and the report will update automatically.
By combining different segment categories, you can analyze your test results even more specifically.
Device category
Segment your reports according to device categories.
Choose between:
- mobile
- desktop
- tablet
New vs returning users
Segment your reports by user type.
Choose between:
- New users
- Returning users
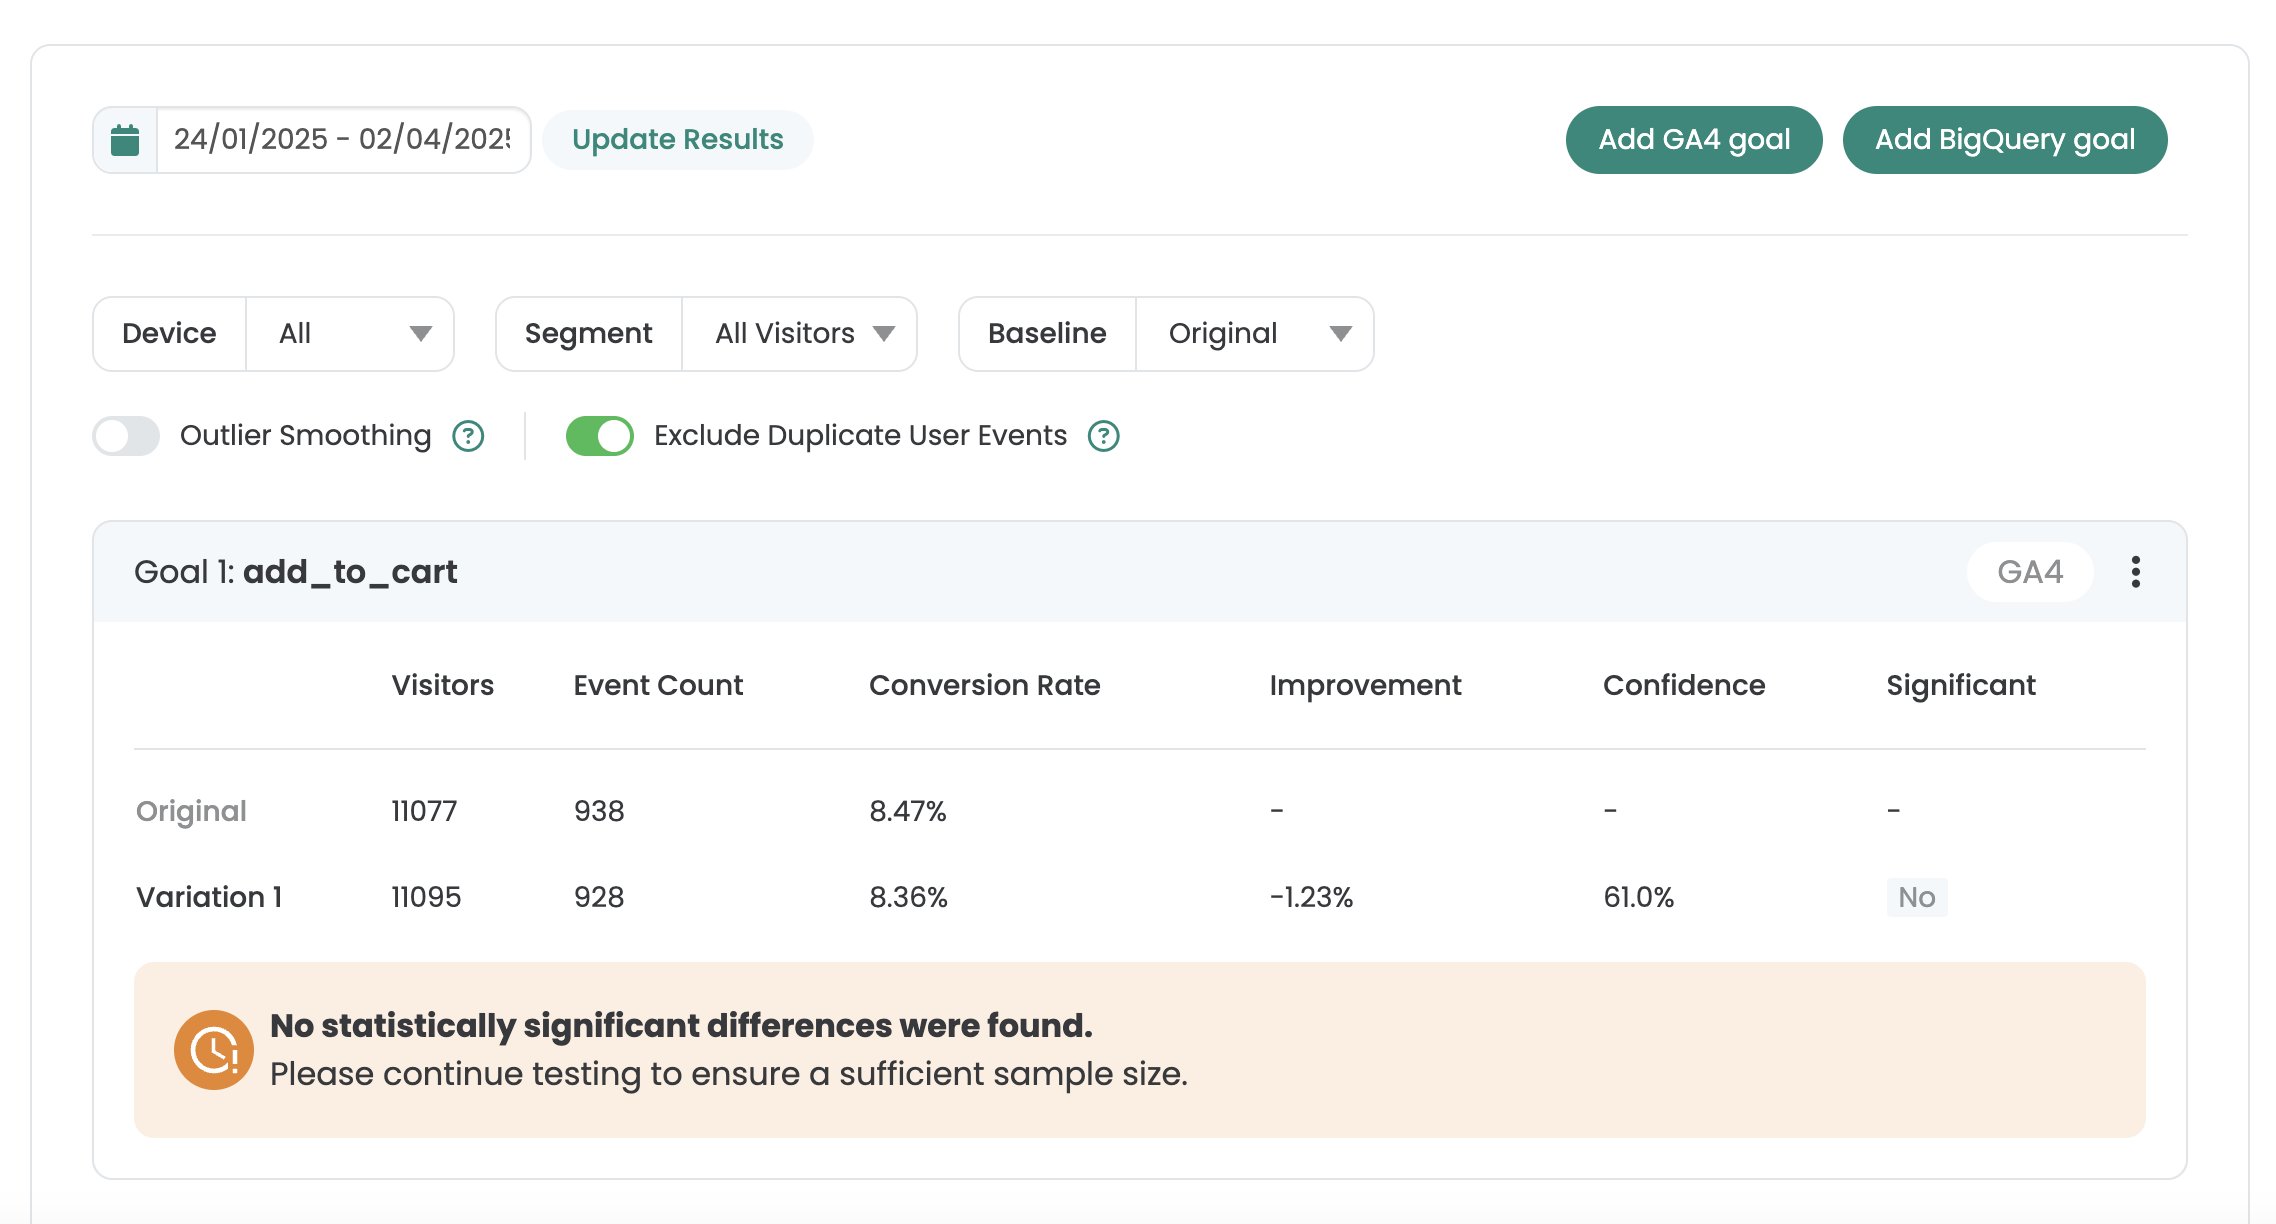
Filter duplicate events
By default, events, key events and metrics are counted multiple times per user in GA4. In A/B testing, however, events should only be counted once by default. The setting "Exclude Duplicate User Events" is activated by default. This means that each event is only counted once per user, even if it was triggered multiple times by one user. You can deactivate this option at any time, which will cause the events to be displayed multiple times.
Please note that the setting only has an effect on events. It does not work for key events and metrics.
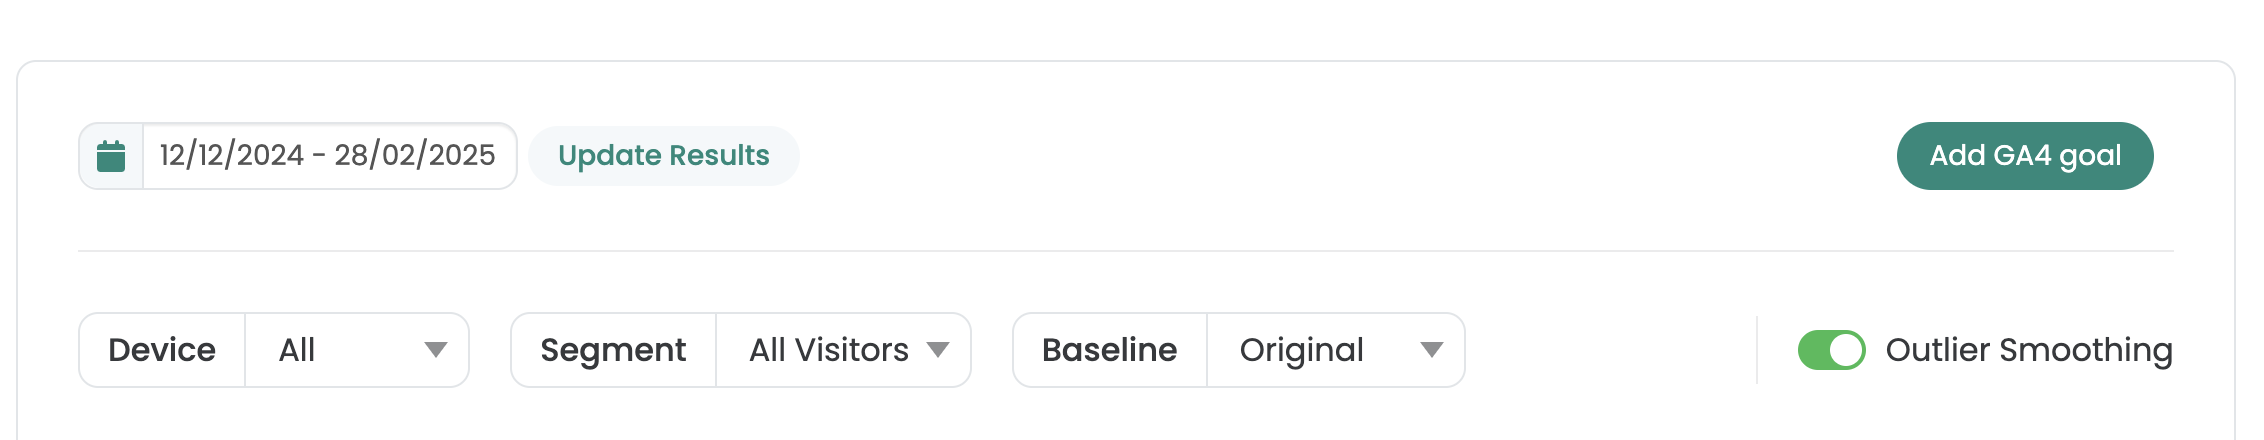
Outlier smoothing
For some orders, the turnover is significantly higher than the average order value of a variant. Such values are statistical Outliers and can distort the overall result of an A/B test. A few extremely high orders can make the total sales of a variant appear artificially better than it actually is.
To prevent this, there is the function „Outlier Smoothing“. All orders of all variants are checked for anomalies. Measured values that are more than three times the standard deviation above the mean value are excluded from the calculation of turnover. This limit (mean value + 3×standard deviation) is a common statistical method for detecting outliers.
Filtering out these values ensures that the comparison of the variants is not distorted by individual extreme orders. The result of the test is therefore based on typical user behavior and not on exceptional situations.