varify.debug
Table of contents
In short
With the varify.debug function, you can easily view all the experiments running on the page via your browser's developer console. You also have access to all information about running experiments in your account, even if they are not currently being played for you.
Call varify.debug
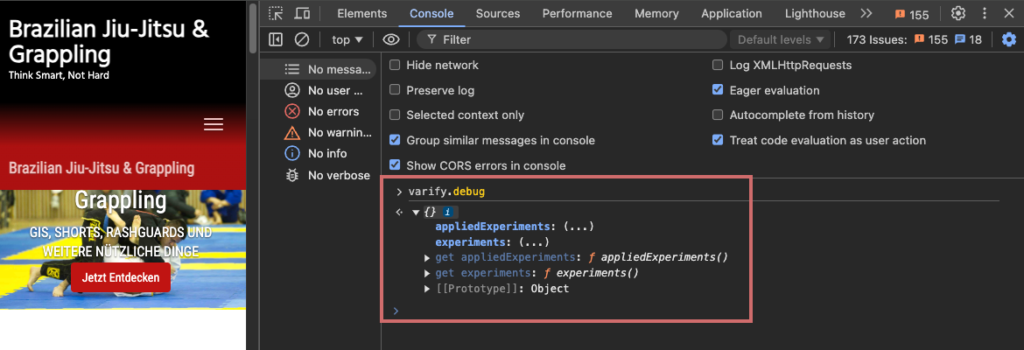
To call the varify.debug function, you can simply go to the developer console of your browser (F12 key or right-click > "Explore") and enter "varify.debug". You can then execute it by entering it.
To open the content of appliedExperiments and experiments, you can click on the three dots (...). The list can then be expanded.

appliedExperiments - varify.debug
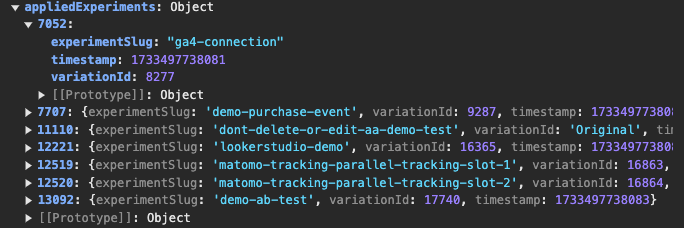
Under appliedExperiments, all actively executed experiments on the accessed page are listed. Experiments that are not played by page targeting or audience targeting are not listed accordingly.
The name of the object under appliedExperiments is the experiment ID. However, the object also contains information such as the name of the experiment and the variation ID in which you are currently located.

experiments - varify.debug
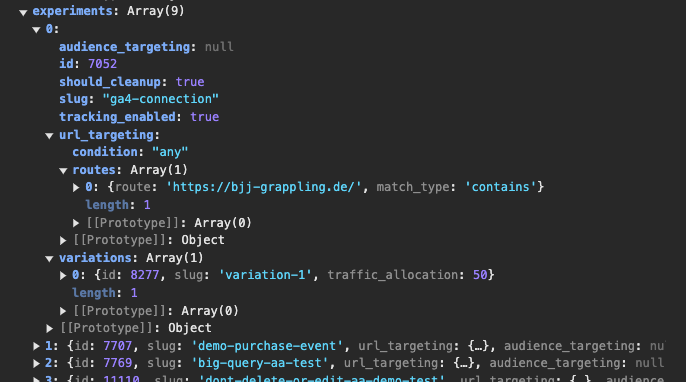
All active experiments in the account are listed in experiments. Experiments that are not executed on the URL accessed due to page targeting or are prevented from being displayed by audience targeting are also listed here.
The objects in experiments contain more information than in appliedExperiments. Listed here:
- Experiment name
- Experiment ID
- All variants incl. IDs
- Traffic Allocation
- Page targeting
- Audience Targeting
- Cleanup Setting
- Tracking Setting

First steps
Tracking & web analytics integrations
- Tracking with Varify
- Manual Google Tag Manager tracking integration
- Automatic GA4 tracking integration
- Shopify Custom Pixel Integration via Google Tag Manager
- Shopify Tracking
- BigQuery
- PostHog evaluations
- Matomo - Integration via Matomo Tag Manager
- etracker integration
- Piwik Pro Integration
- Consent - Tracking via Consent
- Advanced Settings
Create experiment
Targeting
Reporting & evaluation
- Reporting in Varify.io
- BigQuery
- Segment and filter reports
- Share report
- Audience-based evaluation in GA4
- Segment-based evaluation in GA 4
- PostHog Tracking
- Exporting the experiment results from Varify
- Matomo - Results analysis
- etracker evaluation
- Calculate significance
- User-defined click events
- Evaluate custom events in explorative reports
- GA4 - Cross-Domain Tracking
Visual editor
- Campaign Booster: Arrow Up
- Campaign Booster: Exit Intent Layer
- Campaign Booster: Information Bar
- Campaign Booster: Notification
- Campaign Booster: USP Bar
- Add Link Target
- Browse Mode
- Custom Selector Picker
- Edit Content
- Edit Text
- Move elements
- Hide Element
- Keyword Insertion
- Redirect & Split URL Testing
- Remove Element
- Replace Image
- Responsive Device Switcher
- Style & Layout Changes