How Varify calculates the significance
Table of contents
In short
The article explains how Varify evaluates test results with a frequentist method using one-sided chi-square and t-tests to detect significance more quickly. It also explains why longer run times and few metrics - especially for A/A tests - are important to avoid wrong decisions by chance.
Calculation of significance in app.varify.io
Varify uses a statistical algorithm to evaluate test results. frequentist method. It calculates how likely it is that a difference between the variant and the original has arisen by chance. If chance can be ruled out as far as possible, Varify displays the reciprocal of the calculated p-value the so-called Significance. Is this greater than 95 %, the result is displayed in the tool as , displayed.
In order to evaluate the results as efficiently as possible, Varify uses two established statistical tests:
- For binomial targets (e.g. click rate, conversion rate), a one-sided chi-square test used. 
- For sales or value metrics (e.g. Average Order Value, Revenue per Visitor), a one-sided student t-test used. 
These one-sided tests are deliberately chosen. They provide faster results, because they calculate less conservatively than two-sided methods. This allows customers to see earlier whether one variant is likely to perform better.
Of course, there is also a downside to this: if a test runs very short or many metrics at the same time are evaluated, the chance of a so-called False positive - i.e. a result that appears to be significant, although in reality it was only a coincidence.
Therefore:
👉 Better to test a little longer, so that the results stabilize and you can judge more reliably whether a variant is really better.
Especially for A/A tests it is important to only Few destinations to add. Through the so-called Alpha error accumulation each additional metric increases the probability that a False positive is created - in other words, a supposed winner who is not really a winner.
Best practices for A/A testing:
- Running time: at least 10 days 
- At least 500 conversions per variant 
- Maximum 3 destinations with a focus on the Main KPI 
- Significance values occurring in between should be ignored The end result is what counts. This is the only way to keep the false positive rate low and the results truly reliable. 
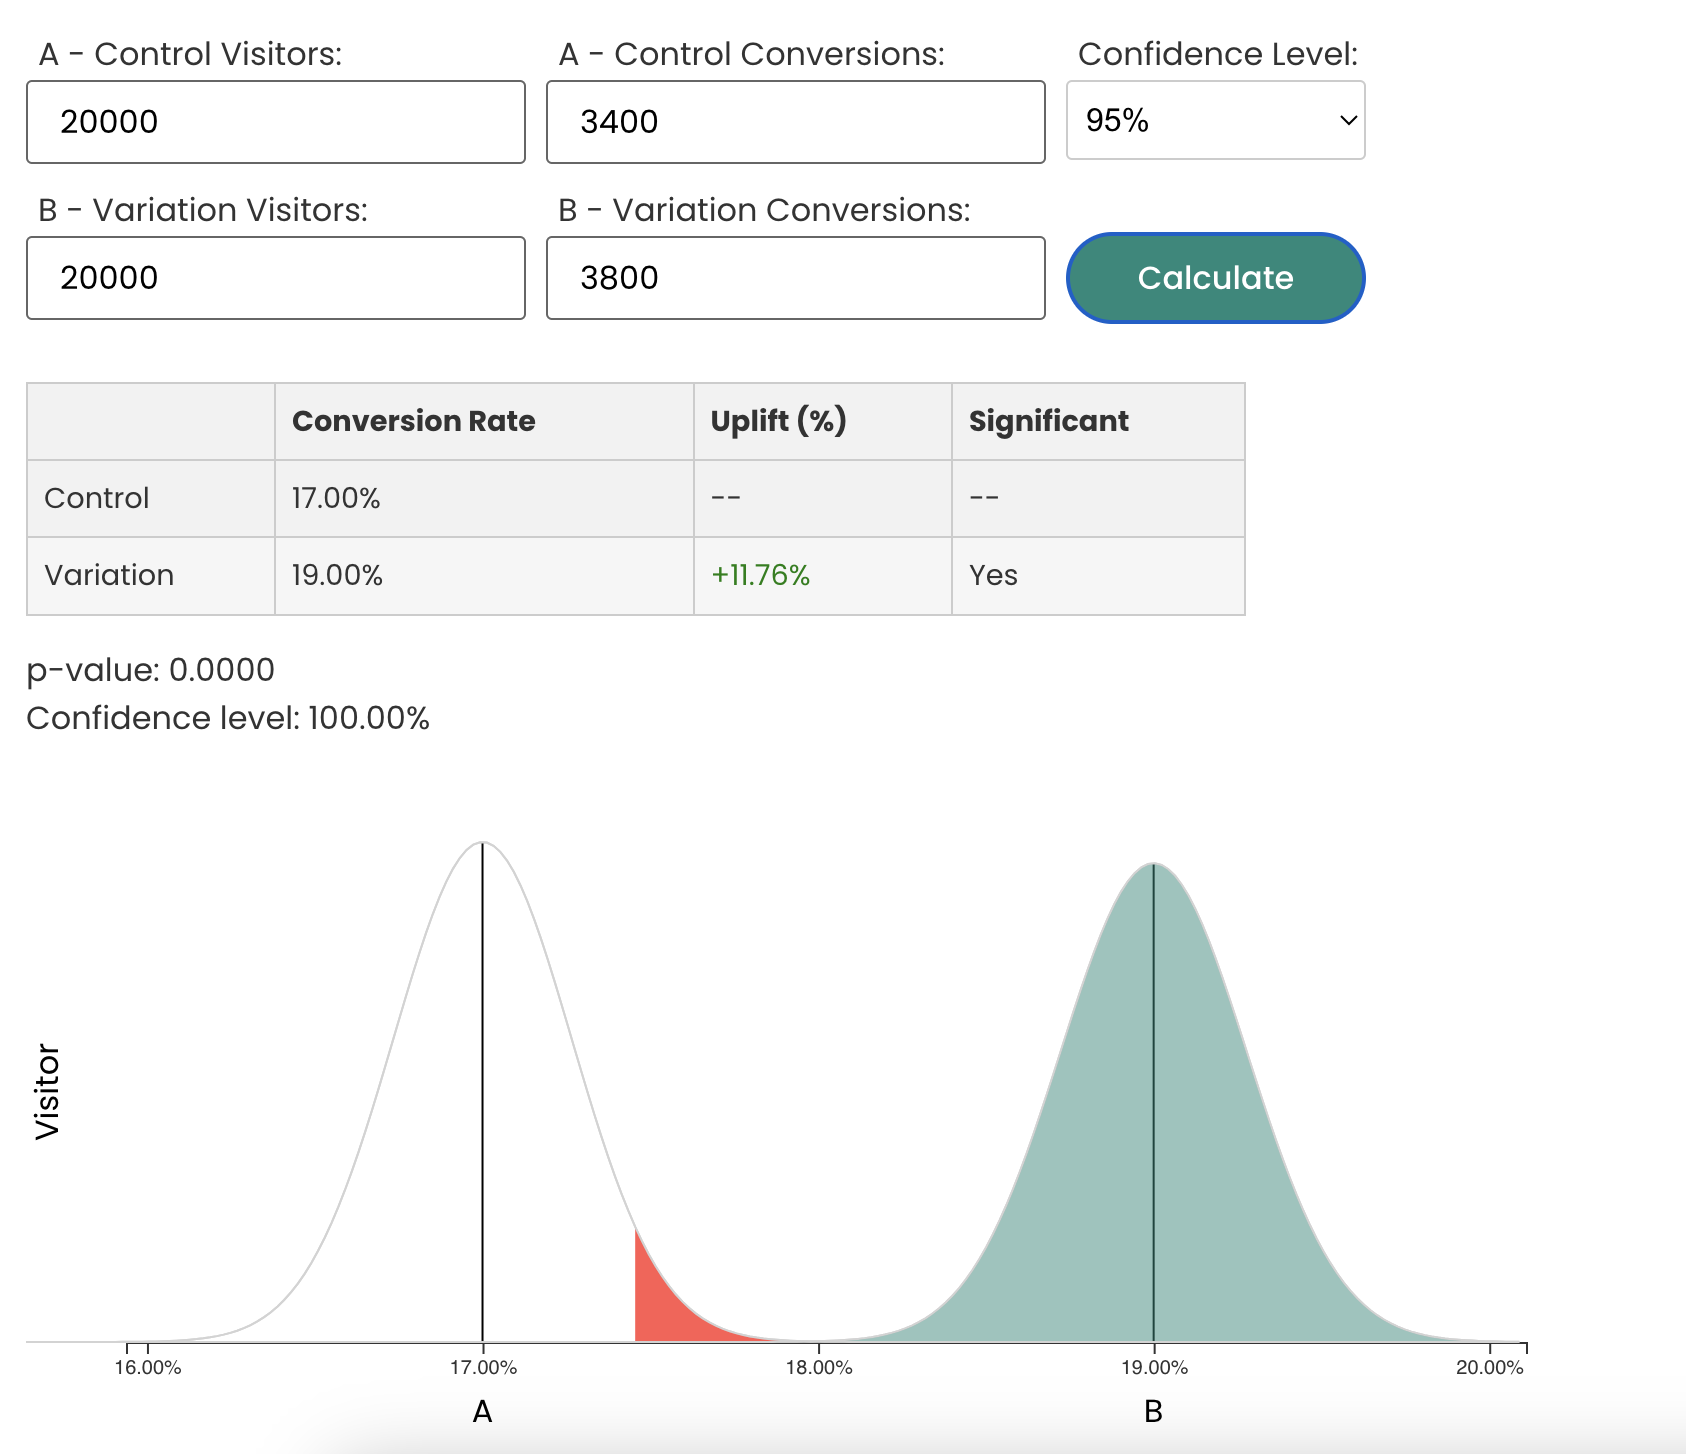
Own calculation of significance using a significance calculator
Check your A/B test results for significant differences. For this purpose Varify.io provides a significance calculator.
 
															
					 First steps 


					 Tracking & web analytics integrations 


				- Tracking with Varify
- Manual Google Tag Manager tracking integration
- Automatic GA4 tracking integration
- Shopify Custom Pixel Integration via Google Tag Manager
- Shopify Tracking
- BigQuery
- PostHog evaluations
- Matomo - Integration via Matomo Tag Manager
- etracker integration
- Piwik Pro Integration
- Consent - Tracking via Consent
- Advanced Settings
- Tracking with Varify
- Manual Google Tag Manager tracking integration
- Automatic GA4 tracking integration
- Shopify Custom Pixel Integration via Google Tag Manager
- Shopify Tracking
- BigQuery
- PostHog evaluations
- Matomo - Integration via Matomo Tag Manager
- etracker integration
- Piwik Pro Integration
- Consent - Tracking via Consent
- Advanced Settings
					 Create experiment 


					 Targeting 


					 Reporting & evaluation 


				- GA4 reporting in Varify.io
- BigQuery
- Segment and filter reports
- Share report
- Audience-based evaluation in GA4
- Segment-based evaluation in GA 4
- PostHog Tracking
- Exporting the experiment results from Varify
- Matomo - Results analysis
- etracker evaluation
- Calculate significance
- User-defined click events
- Evaluate custom events in explorative reports
- GA4 - Cross-Domain Tracking
- GA4 reporting in Varify.io
- BigQuery
- Segment and filter reports
- Share report
- Audience-based evaluation in GA4
- Segment-based evaluation in GA 4
- PostHog Tracking
- Exporting the experiment results from Varify
- Matomo - Results analysis
- etracker evaluation
- Calculate significance
- User-defined click events
- Evaluate custom events in explorative reports
- GA4 - Cross-Domain Tracking
					 Visual editor 


				- Campaign Booster: Arrow Up
- Campaign Booster: Exit Intent Layer
- Campaign Booster: Information Bar
- Campaign Booster: Notification
- Campaign Booster: USP Bar
- Add Link Target
- Browse Mode
- Custom Selector Picker
- Edit Content
- Edit Text
- Move elements
- Hide Element
- Keyword Insertion
- Redirect & Split URL Testing
- Remove Element
- Replace Image
- Responsive Device Switcher
- Style & Layout Changes
- Campaign Booster: Arrow Up
- Campaign Booster: Exit Intent Layer
- Campaign Booster: Information Bar
- Campaign Booster: Notification
- Campaign Booster: USP Bar
- Add Link Target
- Browse Mode
- Custom Selector Picker
- Edit Content
- Edit Text
- Move elements
- Hide Element
- Keyword Insertion
- Redirect & Split URL Testing
- Remove Element
- Replace Image
- Responsive Device Switcher
- Style & Layout Changes