Analyzing Custom Events in Varify and in GA4 Explorations
Table of contents
In short
There are two ways to analyze the results of your custom events:
- In the Varify Result Report—right in the Varify.io dashboard. Once you’ve linked to GA4, all events and metrics are automatically available as goal options. For revenue custom events, the event must be marked as a key event in GA4 so that it appears under “Key Events” in the Result Report.
- In GA4's exploratory reports—it's recommended to create a custom metric for the event rather than analyzing it using the key event or conversion metric.
The prerequisite is that your custom event has already been created and assigned an event parameter (see „Creating Custom Events in GA4”).
Analysis Using the Varify Result Report
The fastest way is to analyze the data directly in the Varify.io dashboard. To do this, your GA4 property must be linked to Varify, and the „In Varify and GA4” reporting option must be selected in the tracking setup.
Select Custom Events as a Goal
After connecting to GA4 once, all events and metrics are automatically imported and appear in the Results Report as goal options—without the need for manual setup. Navigate to your experiment’s results, click „Add GA4 Goal,” and select your custom event. You’ll then see the uplift and significance for each variant.
Revenue Custom Events: Mark as a Key Event
There is one special feature regarding Revenue Custom Events. For a custom revenue event to appear in the Result Report under "Key Events" and be selectable as a goal, it must be marked as a Key Event in GA4:
- In GA4, go to Administration → Events (or Key Events).
- Find your Revenue Custom Event and turn on the "Mark as Key Event" toggle.
- If the event hasn't been recorded yet, click "New Key Event" and enter the event name exactly as GA4 receives it.
Once the event is marked as a key event, it appears under „Key Events" in the Varify Result Report and can be analyzed there as a goal. (You can also find the steps for marking events in the article “Creating Custom Events in GA4.”)
Note on sales value: A message sent with the event
value-The parameter does not automatically populate the GA4 default revenue metric Total Revenue. True revenue—the kind that can be aggregated into revenue metrics—is generated only through a single transaction (e.g., thepurchase-Event withvalueandcurrency). If you've set up transaction IDs in GA4, your Revenue Goals in the Results Report will also display a significance calculation and the Average Revenue per User (ARPU).
Analysis in Exploratory Reports (GA4)
Recommendation: Use a custom metric
Prerequisite: Custom metric created in GA4
To add the event as a custom metric, you need to set up a Custom Metric must be created for the event parameter. You can find instructions on how to do this in the article „Creating Custom Events in GA4" Described under „Creating Numeric Values as Custom Metrics.”.
Note: A custom metric begins collecting data only after it has been created (not retroactively), and it takes 24–48 hours for the data to become available in the exploratory reports.
Insert a custom metric into the exploratory report
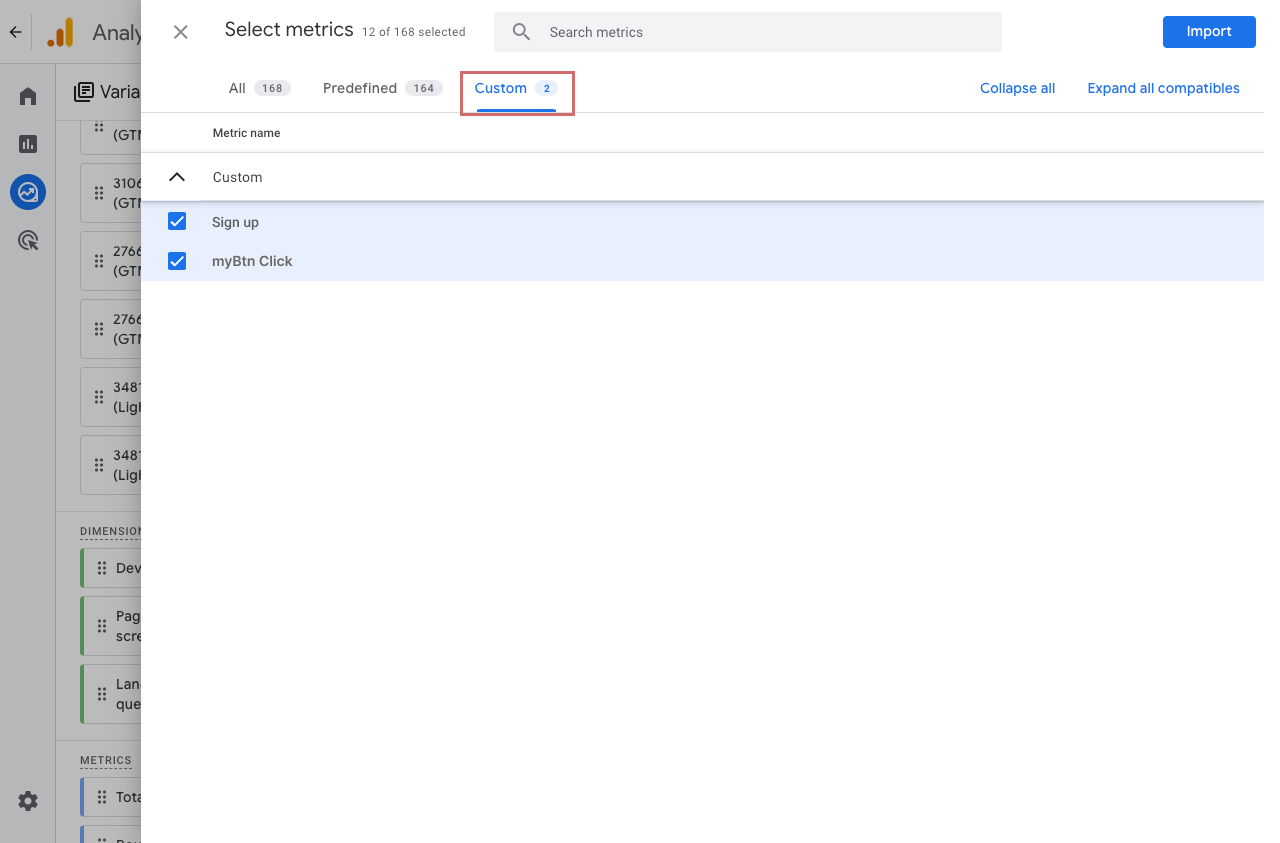
To display the metric in the exploratory report, first add it to the left-hand variable column. To do this, click on the +-symbol next to „Metrics” and search for the metric you created. Alternatively, you can find it in the tab „Custom” Select and import.
Next, drag the metric to the right into the Settings column in the Values. The custom metric will then appear in your report.
Not Recommended: Analyzing Events Using Key Events / Conversions
In the exploratory reports, you cannot add events directly as separate metrics. However, you can mark an event as a key event (formerly „conversion”), which turns it into a metric Key Events is added.
However, analyzing the data can be difficult because the „Key Events” metric groups together all events that have been marked as key events. It is better to examine individual events separately.
At the very bottom of the Settings column, you can filter by a specific event:
- End of the "Settings" column → Filters
- Filter Name: Event Name
- Conditions: „exactly matches”
- Enter the name of the custom event and click „Apply” apply
Example: Here, the filter was set to „Sign Up.” The „Key Events” metric now shows the numbers for that event—however, it also includes the Total Users significantly lower than without a filter, since only users who triggered this event are displayed.
This makes the analysis confusing and prone to errors. What would actually be relevant is the total number of users without any filters.