

A test shows +3 % conversion uplift. Sounds convincing - until you check the data in BigQuery. Because what GA4 reports often conceal: The result is based on modeled users, sampled sessions and smoothed metrics.
The effect? An apparent test victory that isn't one.
If you want to make informed decisions, you can't rely on pre-digested dashboards. Instead, you need to understand what has really happened.
False security is more dangerous than insecurity!
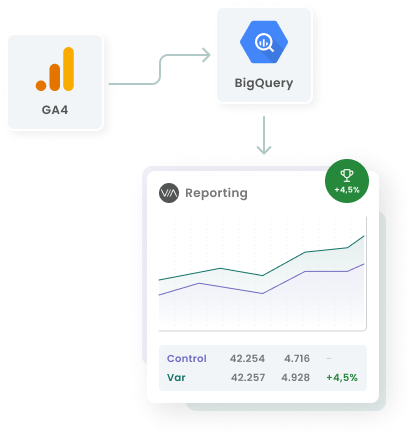
Google Analytics 4 vs. BigQuery
GA4 and BigQuery access the same data set, but what they do with it is fundamentally different.
GA4 uses probabilistic methods, such as HyperLogLog++, to estimate user numbers when traffic is high. This saves computing load, but results in key figures such as users or conversions being slightly inflated. From around 12,000 visitors per variant, the reported user and conversion figures sometimes deviate noticeably from the actual values.
If the same test is analyzed in BigQuery, a different picture emerges: the uplift shrinks, the significance decreases. Why? Because BigQuery works with the real raw data, not with estimated values.
| BigQuery | Google Analytics 4 |
|---|---|
| Saves raw event data | Shows processed and aggregated data |
| Data is always unsampled (not sample-based) | Can use sampling in reports |
| Data is organized in daily tables, with an event schema | Data is displayed in predefined reports and customizable explorations |
| SQL is required to query and analyze data | Uses a graphical user interface |
| Data is exported the following day (can take up to 72 hours) | Data can take up to 48 hours to process |
| Free of charge (within the predefined limits) | Free of charge (with upgrade to GA4 360) |
In short:
GA4 simplified - BigQuery made more precise.
The important thing is: It's not just about GA4. Many A/B testing tools also work with modeled and smoothed data. This is precisely why the principle applies: trust the raw data and scrutinize smooth surfaces.
How easy it is to make a mistake: A concrete example
This example comes from an A/B test around a redesign of the Buybox. The aim was to optimize user guidance and increase the conversion rate. The tested variant is shown below.
The difference between GA4 and BigQuery can be seen particularly clearly in this test.

The key figures below were calculated using Google Analytics 4 and provide an overview of the performance of the tested variants:
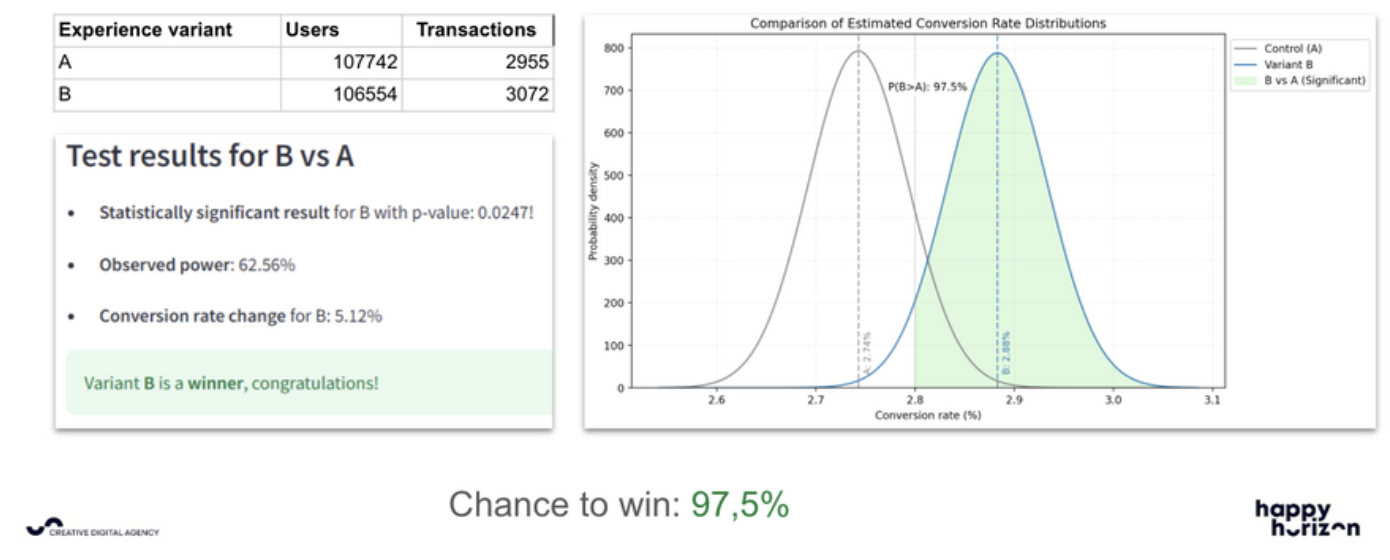
The following key figures were calculated with the help of BigQuery evaluated:
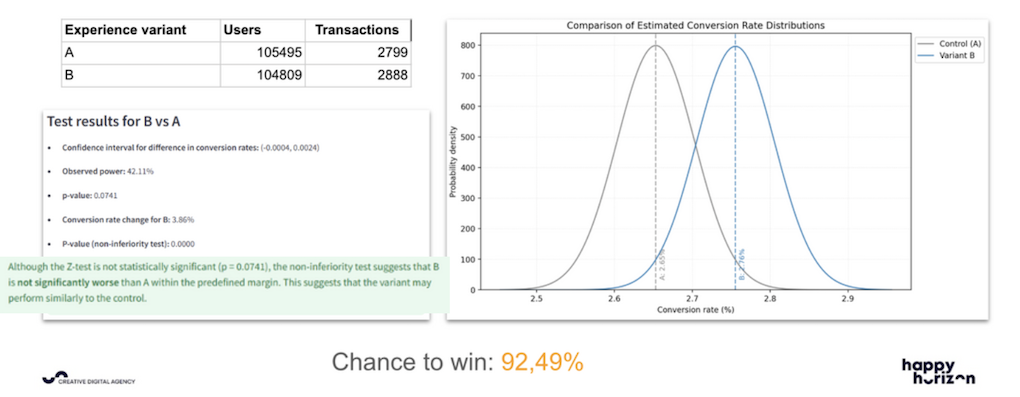
Test BigQuery with Varify.io
Free of charge and completely without SQL
If you use Varify, you don't have to deal with SQL yourself.
After you connect Varify to BigQuery either through our automatic setup or by selecting the right data source, the experiment data is automatically synchronized - including exposures, conversions and variant assignments.
You can find more details in this blog post:
Conclusion
Good test evaluation does not start with the dashboard, but with the question of whether you can trust the figures. If you want to make well-founded decisions, you need clarity about the data basis and control over its interpretation. GA4 provides quick visualizations. BigQuery provides reliable answers.
If you want to understand what really matters in a reliable experiment analysis and how to avoid typical mistakes, then it's worth taking a look at the white paper.
All Info, Examples and Templates can be found compactly and practically in the full white paper:
👉 Download here for free
Individual references
- Analytics‑Toolkit.com (2020): The Perils of Using Google Analytics User Counts in A/B Testing. Published 2020 (updated September 2022 & January 2023). [Accessed on: 21.07.2025]