Evaluation of custom events in explorative reports
Table of contents
In short
To evaluate custom events in the exploratory reports, you need to create a custom metric for the event in Google Analytics 4.
Not recommended: Evaluation of events via conversions in explorative reports
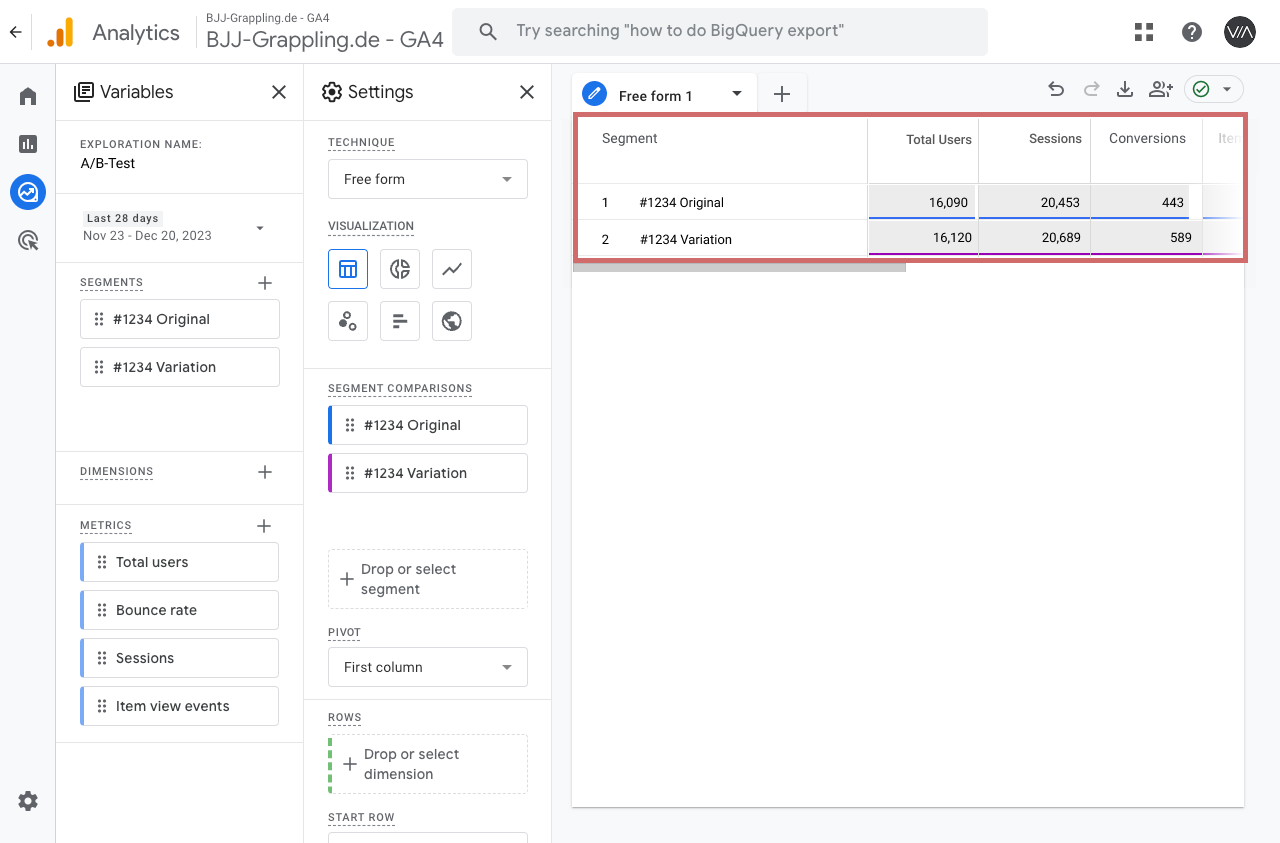
In Google Analytics 4, you cannot add events directly as a separate metric in the exploratory reports. You can mark an event as a conversion, which will then be added to the Conversions metric.
However, the evaluation in the exploratory reports can then be difficult, as the "Conversions" metric summarizes all events that were marked as conversions. It is better to look at events or different conversion events individually.
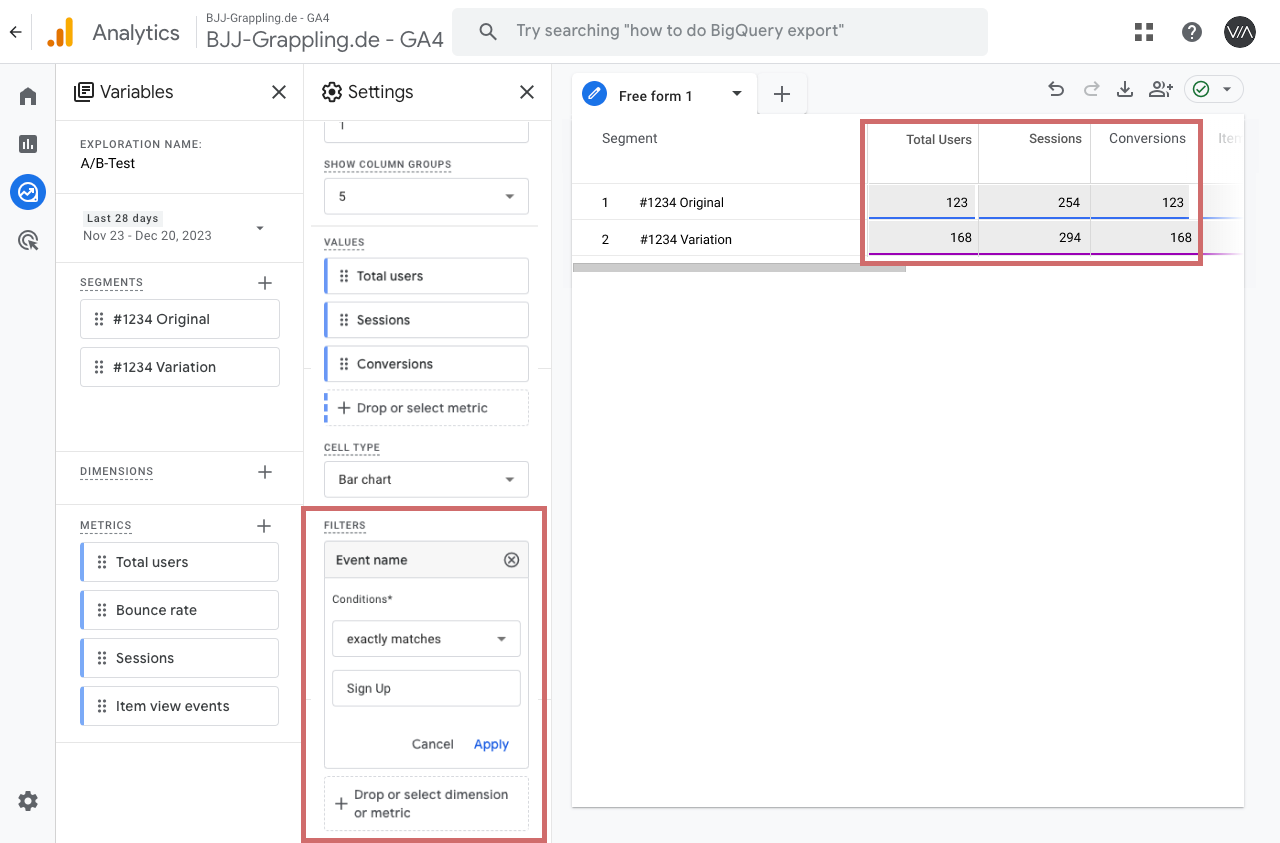
You can filter for specific conversion events in the Settings column at the bottom:
- End of the Settings column -> Filters
- Name of the filter: Event Name
- Conditions: "exactly matches"
- Enter the name of the custom event and apply with "Apply"
For example, "Sign Up" was filtered here. The "Conversions" metric now shows the figures for the event, but the "Total Users" are also significantly lower than without the filter, as only users who have triggered this event are displayed.
This makes an evaluation confusing and error-prone. -> The "Total user" number from the screenshot above would be relevant.
Recommendation: Create custom events as custom metric
Add event parameters
If your custom event does not yet send a parameter to GA4, you should add it to your event before creating the custom metric.
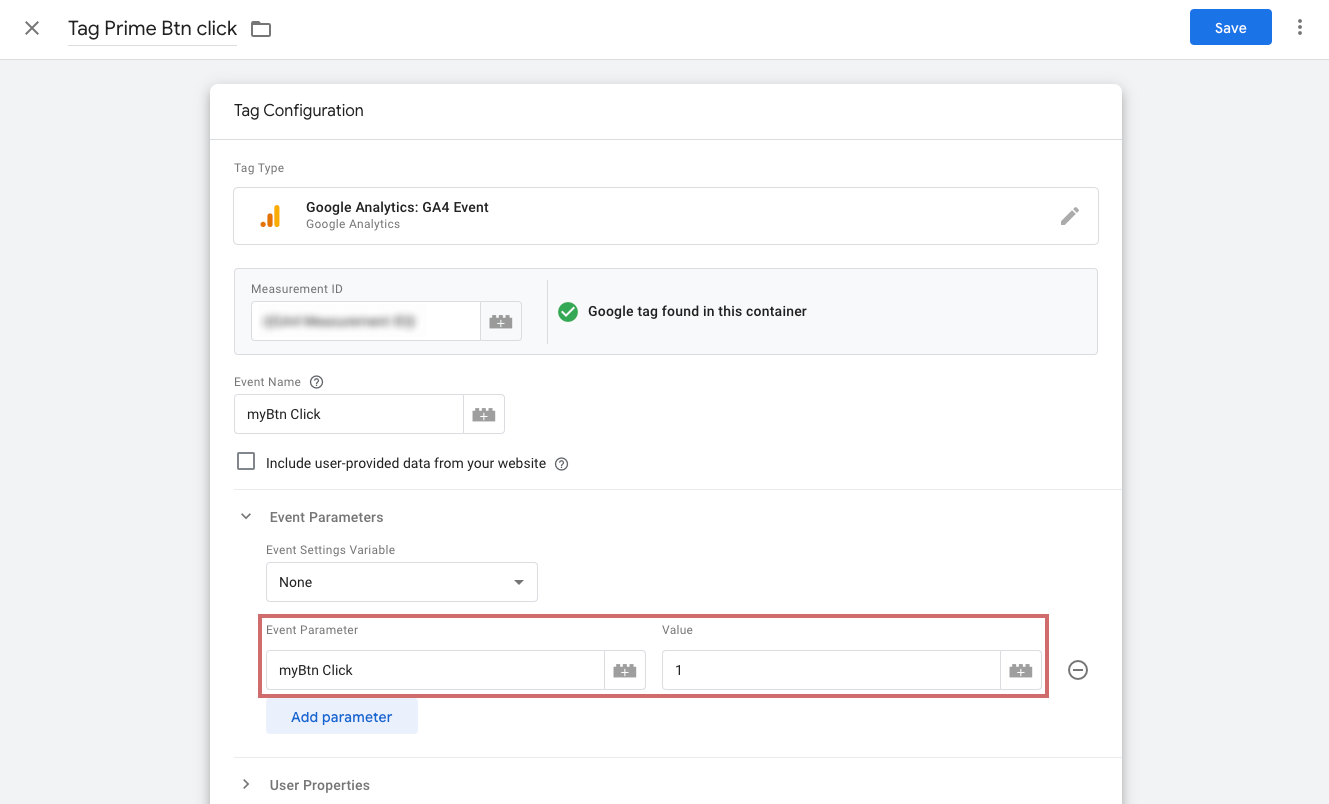
If you have created your custom event via the GTM, you can easily add a parameter via the event itself under "Event parameters".
- Open the "Event parameters" tab
- Then click on the blue "Add parameter" button
- Enter the name of the event in the "Event parameter" field
- Enter the number 1 under Value
- Publish the changes to the GTM container
Create custom events as custom metric
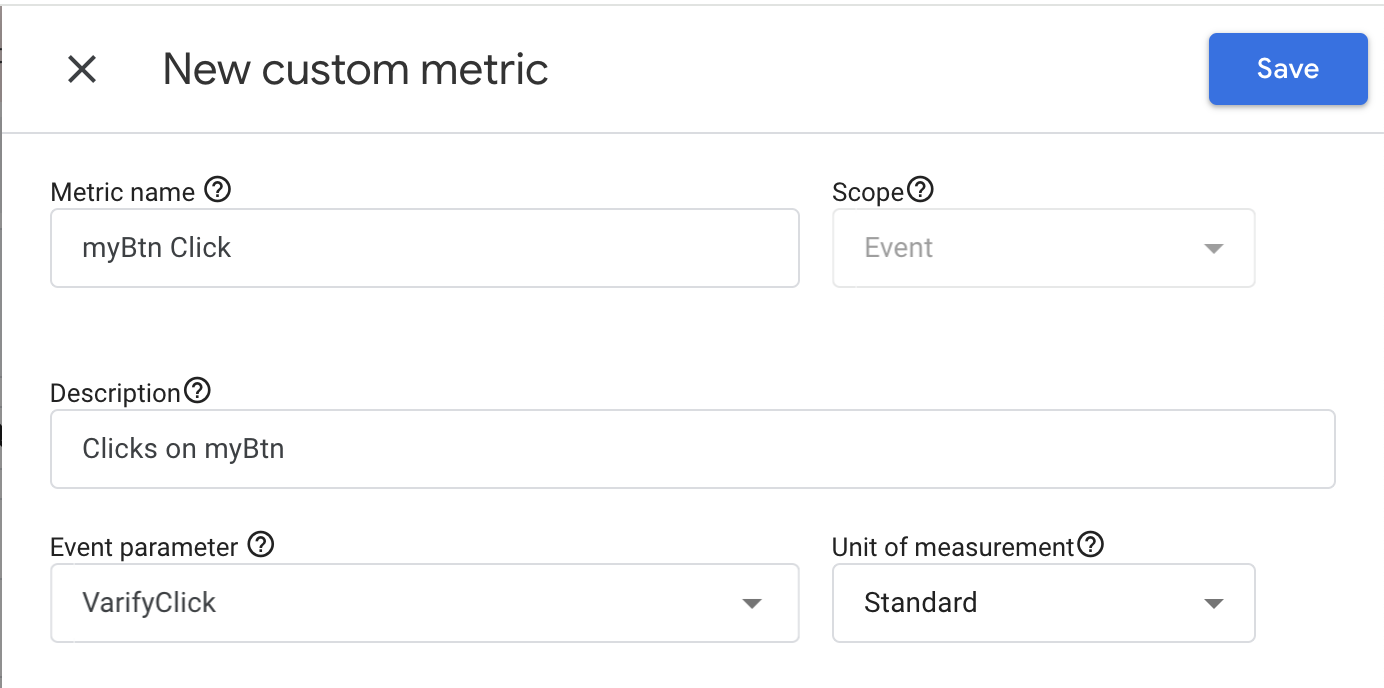
To create custom metrics in GA4, go to "Admin" > "Custom Definitions" > "Custom Metrics" > "Create Custom Metric".
Enter a meaningful name and optionally a short description. Select the event parameter from the drop-down menu or add it manually. Pay attention to the exact spelling of the event.
In the "Unit of Measurement" field, you can usually leave the value "Standard". Now save the user-defined metric.
It takes 24-48 hours for data to be available in the exploratory reports. Also note that event data is not retroactively assigned to a custom metric. A created custom metric only collects data once it has been created.
Insert custom metric in exploratory report
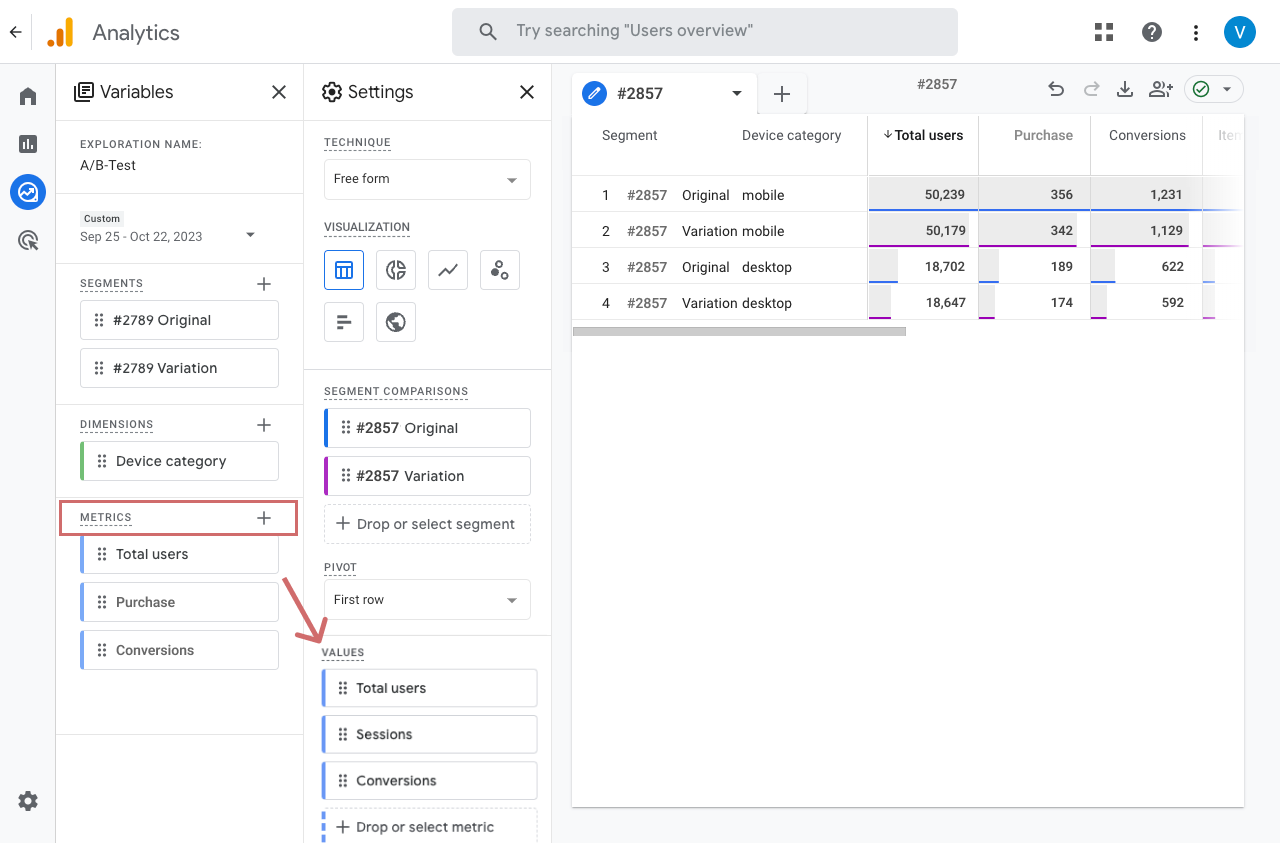
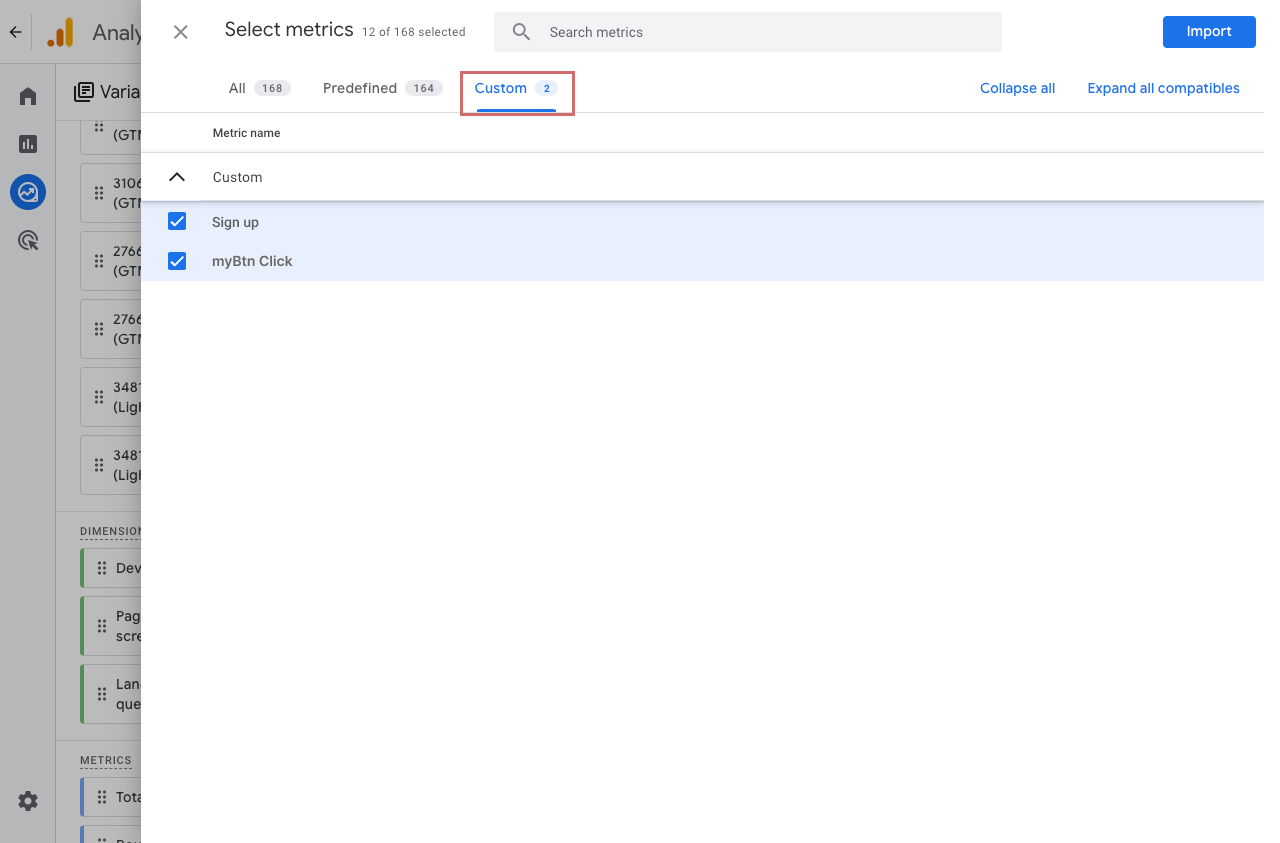
To display the metric in the exploratory report, you must first add it to the left-hand variables column. To do this, click on the + symbol next to "Metrics" and search for the metric you have created. Alternatively, you can select and import it in the "Custom" tab.
You can then drag the added metric to the right, into the Settings column, into the Values area. The custom metric will then appear in your report.
First steps
Tracking & Evaluation
- Tracking with Varify.io
- GA4 reporting in Varify.io
- Segment and filter reports
- Audience-based evaluation in GA4
- Segment-based evaluation in GA 4
- Matomo - Results analysis
- etracker evaluation
- Calculate significance
- User-defined click events
- Evaluate custom events in explorative reports
- GA4 - Cross-Domain Tracking
Web analytics integrations
Further integrations
Create experiment
Expert functions
Visual editor
- Campaign Booster: Arrow Up
- Campaign Booster: Exit Intent Layer
- Campaign Booster: Information Bar
- Campaign Booster: Notification
- Campaign Booster: USP Bar
- Add Link Target
- Browse Mode
- Custom Selector Picker
- Edit Content
- Edit Text
- Move elements
- Hide Element
- Keyword Insertion
- Redirect & Split URL Testing
- Remove Element
- Replace Image
- Responsive Device Switcher
- Style & Layout Changes