Evaluate experiments in Varify.io
Table of contents
In short
You can link your Google Analytics 4 property directly to Varify. This allows you to evaluate your experiments directly in Varify.io with one click and determine a winning variant.
Step-by-Step Tutorial
Set up GA4 evaluation in the tool
Link Google Analytics Property
- In the dashboard, navigate to "Go to Tracking Setup" and then click on the left side on "Analytics Connection“.
- Link your Google Analytics account with Varify.io by clicking on "Sign in with Google“.
- Log in with the account that is also linked to the Google Analytics property. Confirm access to your Google account through Varify.io.
IMPORTANT: You need at least the "Marketer" role for the GA4 account.

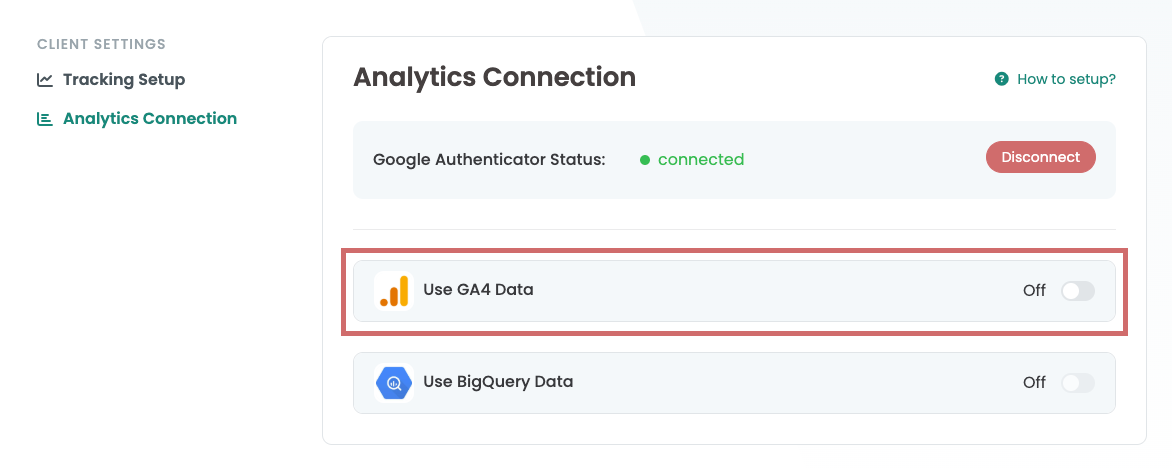
- Now activate the switch at "Use GA4 Data“
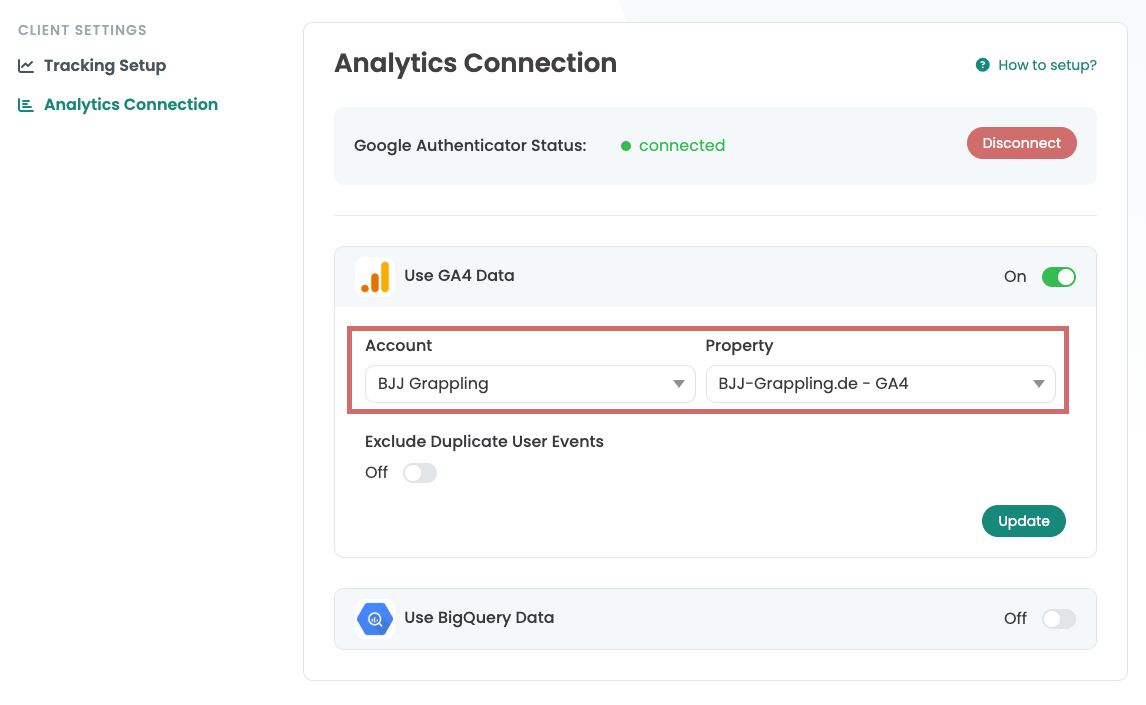
- 5. now select the appropriate GA4 account and property of your website that you want to evaluate from the two drop-downs.
- Confirm the selection with "Update“
Calling up the experiment evaluation
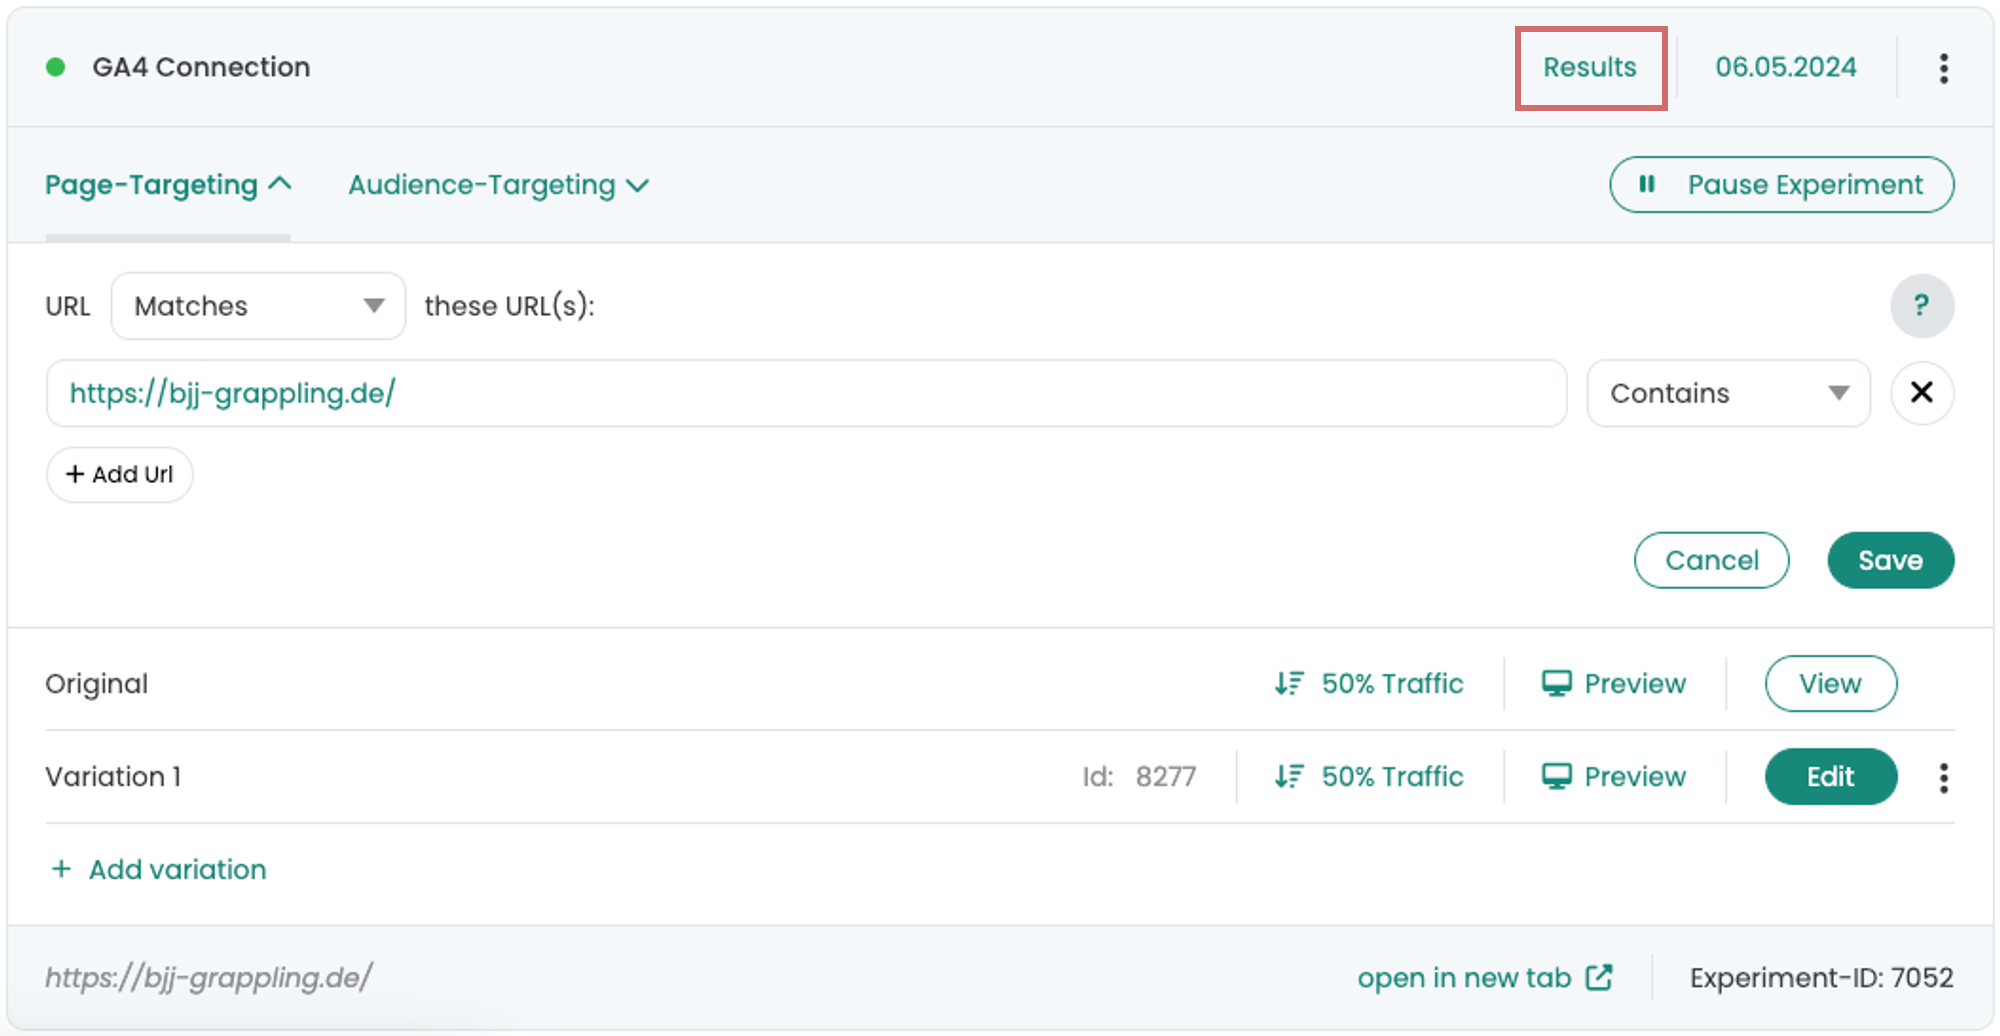
The reporting feature is only available for newly created experiments that were created after the GA4 connection was established.
As soon as you start a new experiment, the "Results" section will appear at the top right of the experiment. Click on it to go to the evaluation report.
Creating the report
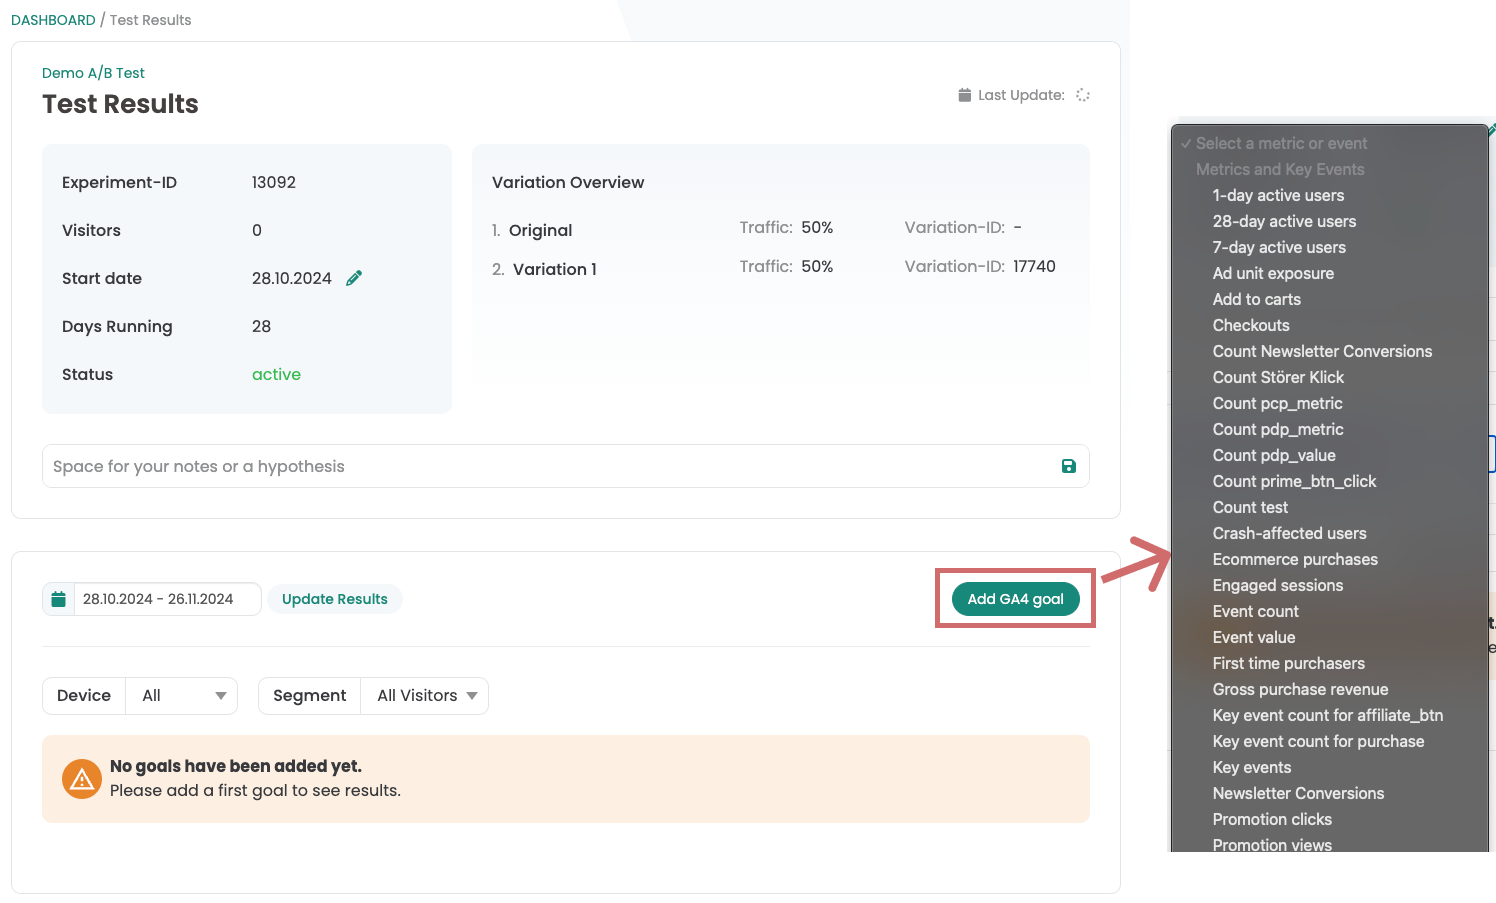
You can add various Google Analytics goals on the report page.
- To do this, click on the "Add new goal" button.
- Select the metric you want to evaluate from the list
- Confirm the selection with the green tick.
You can assign several metrics, key events or events to a report. Each of these is then displayed separately as a new goal in the list.
The metric (or event or key event) has been added to the report. For each goal, the metrics are compared between the different variants. For each variant, the number of visitors is set in relation to the measured metric and shown as the conversion rate. In addition, the improvement, confidence and significance are calculated and displayed.
The reporting period can be adjusted using the date input fields and confirmed with "Update Results".
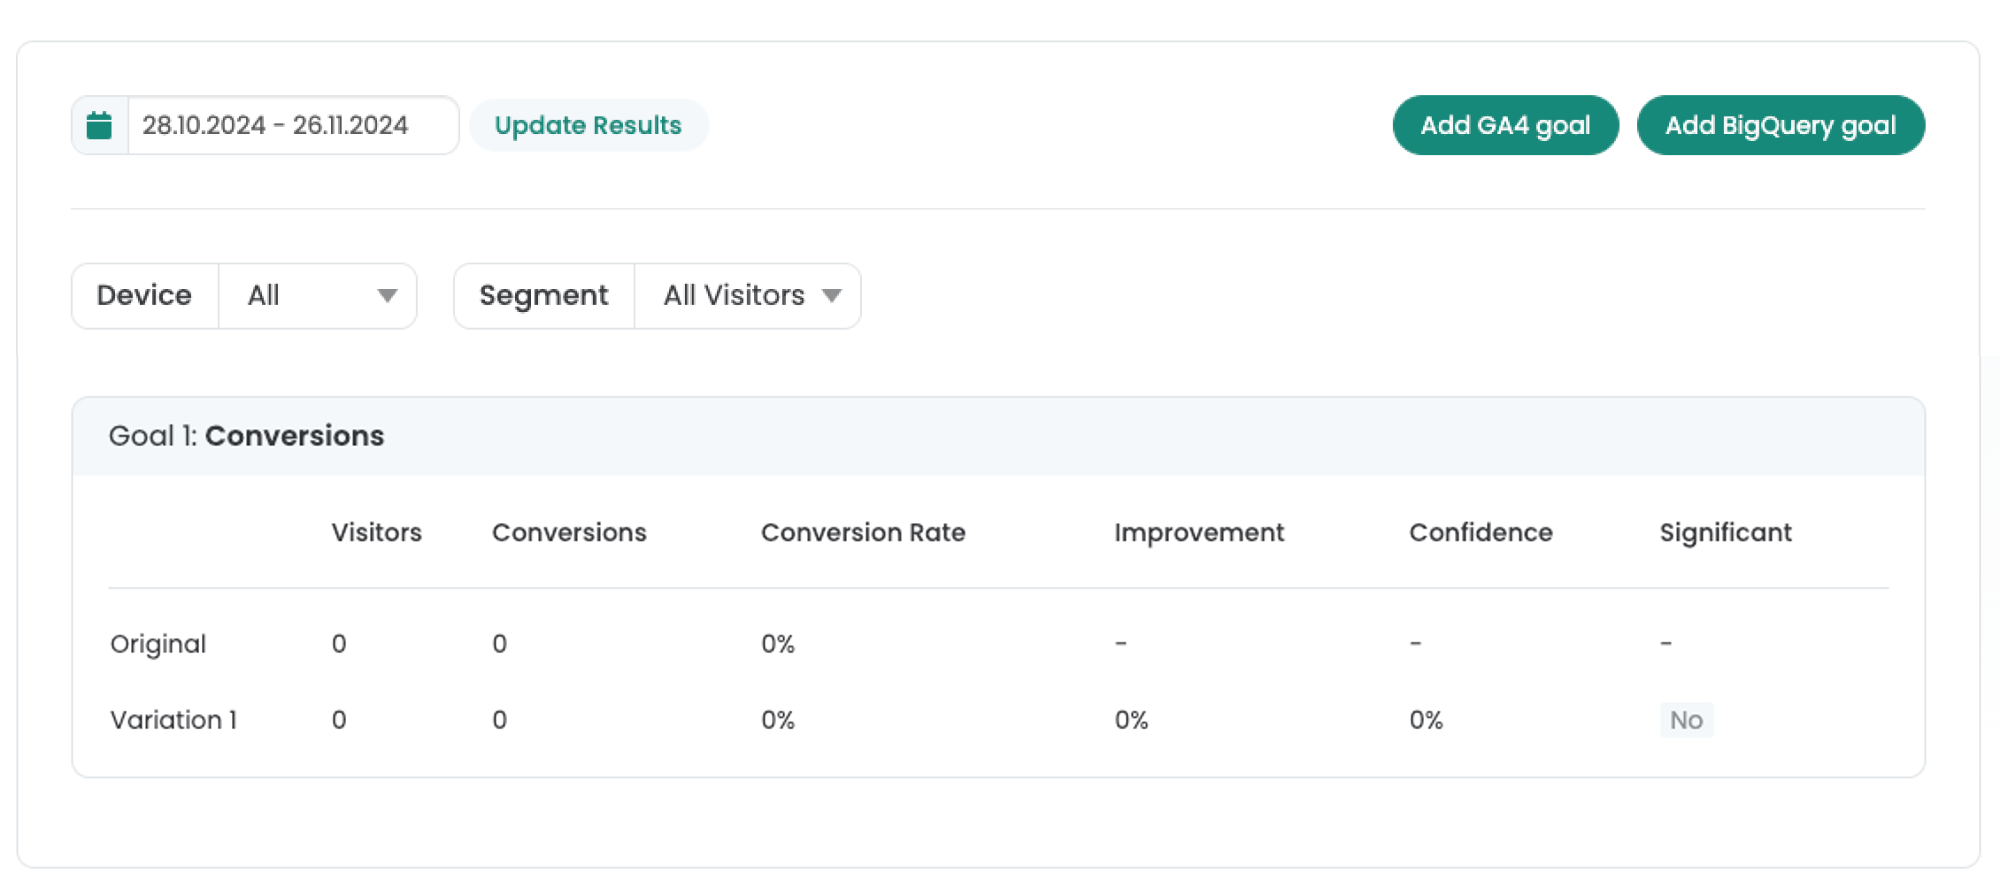
Evaluation of the test results
A conversion rate and an uplift are calculated based on the number of visitors in the variant and the values of the selected metric.
To check whether your experiment is statistically significant, you can use the confidence level for the evaluation. Variants with a confidence level of 95 % or higher are highlighted with a green "Yes".
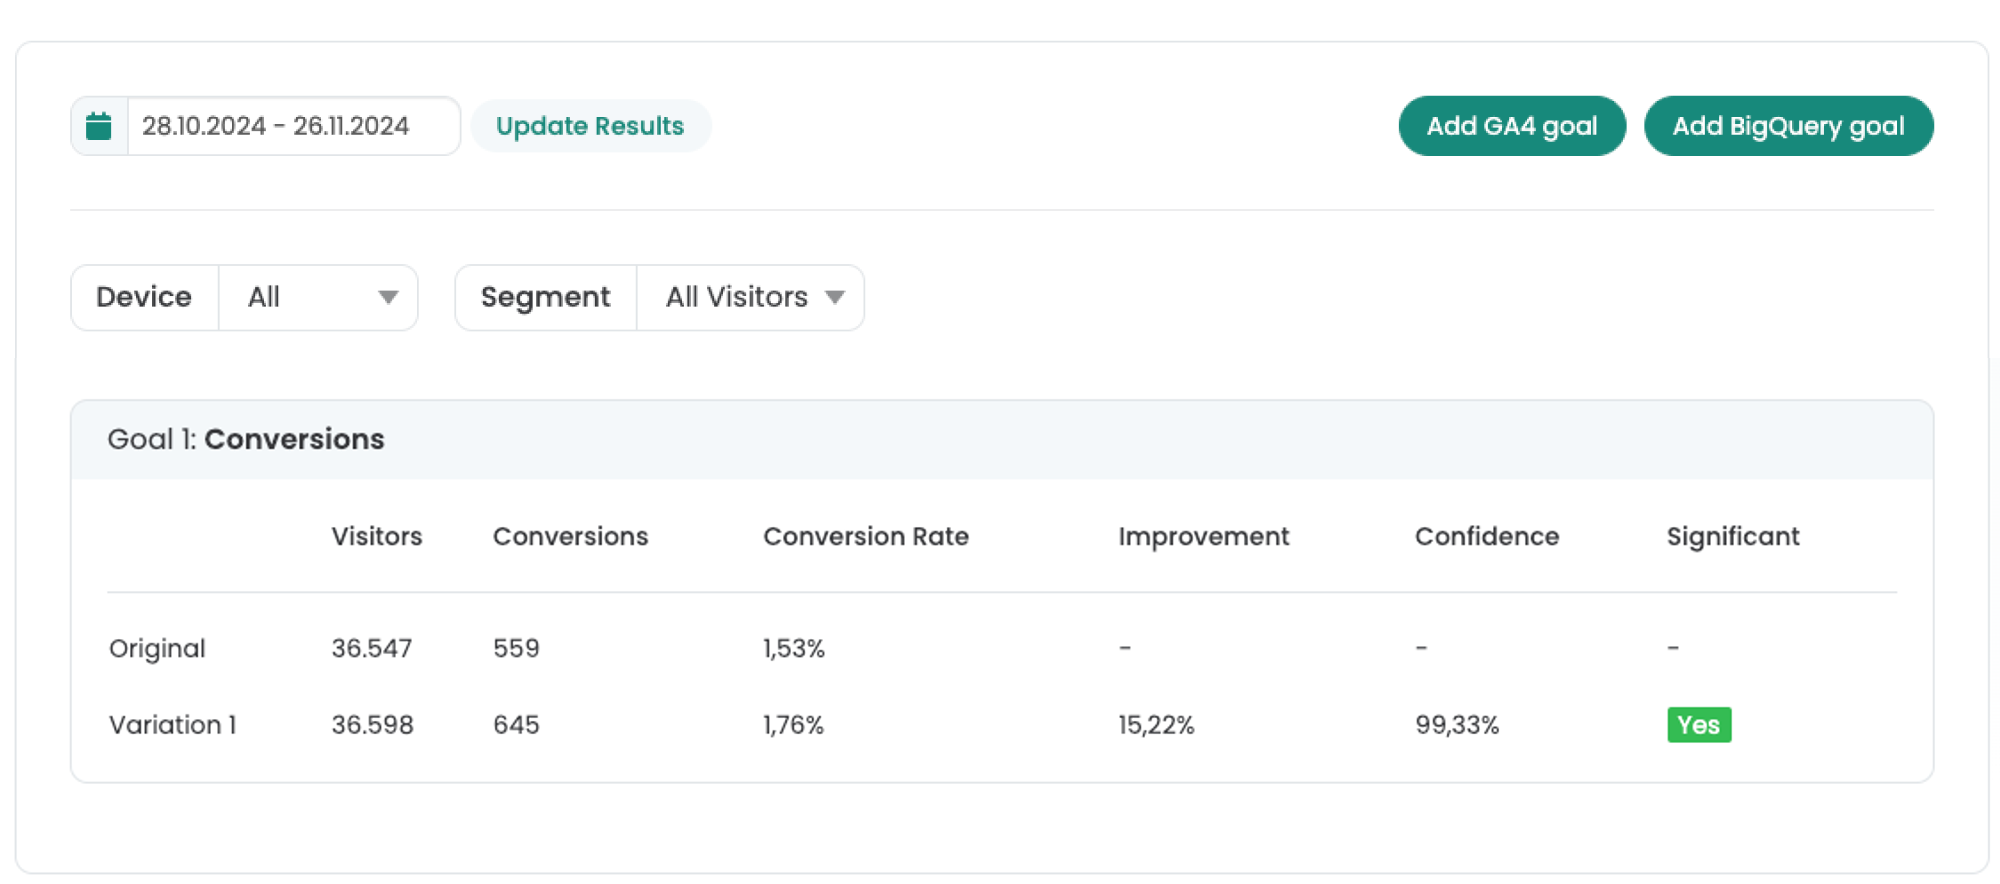
First steps
Tracking & Evaluation
- Tracking with Varify.io
- GA4 reporting in Varify.io
- Segment and filter reports
- Audience-based evaluation in GA4
- Segment-based evaluation in GA 4
- Matomo - Results analysis
- etracker evaluation
- Calculate significance
- User-defined click events
- Evaluate custom events in explorative reports
- GA4 - Cross-Domain Tracking
Web analytics integrations
Further integrations
Create experiment
Expert functions
Visual editor
- Campaign Booster: Arrow Up
- Campaign Booster: Exit Intent Layer
- Campaign Booster: Information Bar
- Campaign Booster: Notification
- Campaign Booster: USP Bar
- Add Link Target
- Browse Mode
- Custom Selector Picker
- Edit Content
- Edit Text
- Move elements
- Hide Element
- Keyword Insertion
- Redirect & Split URL Testing
- Remove Element
- Replace Image
- Responsive Device Switcher
- Style & Layout Changes