etracker evaluation
Table of contents
In short
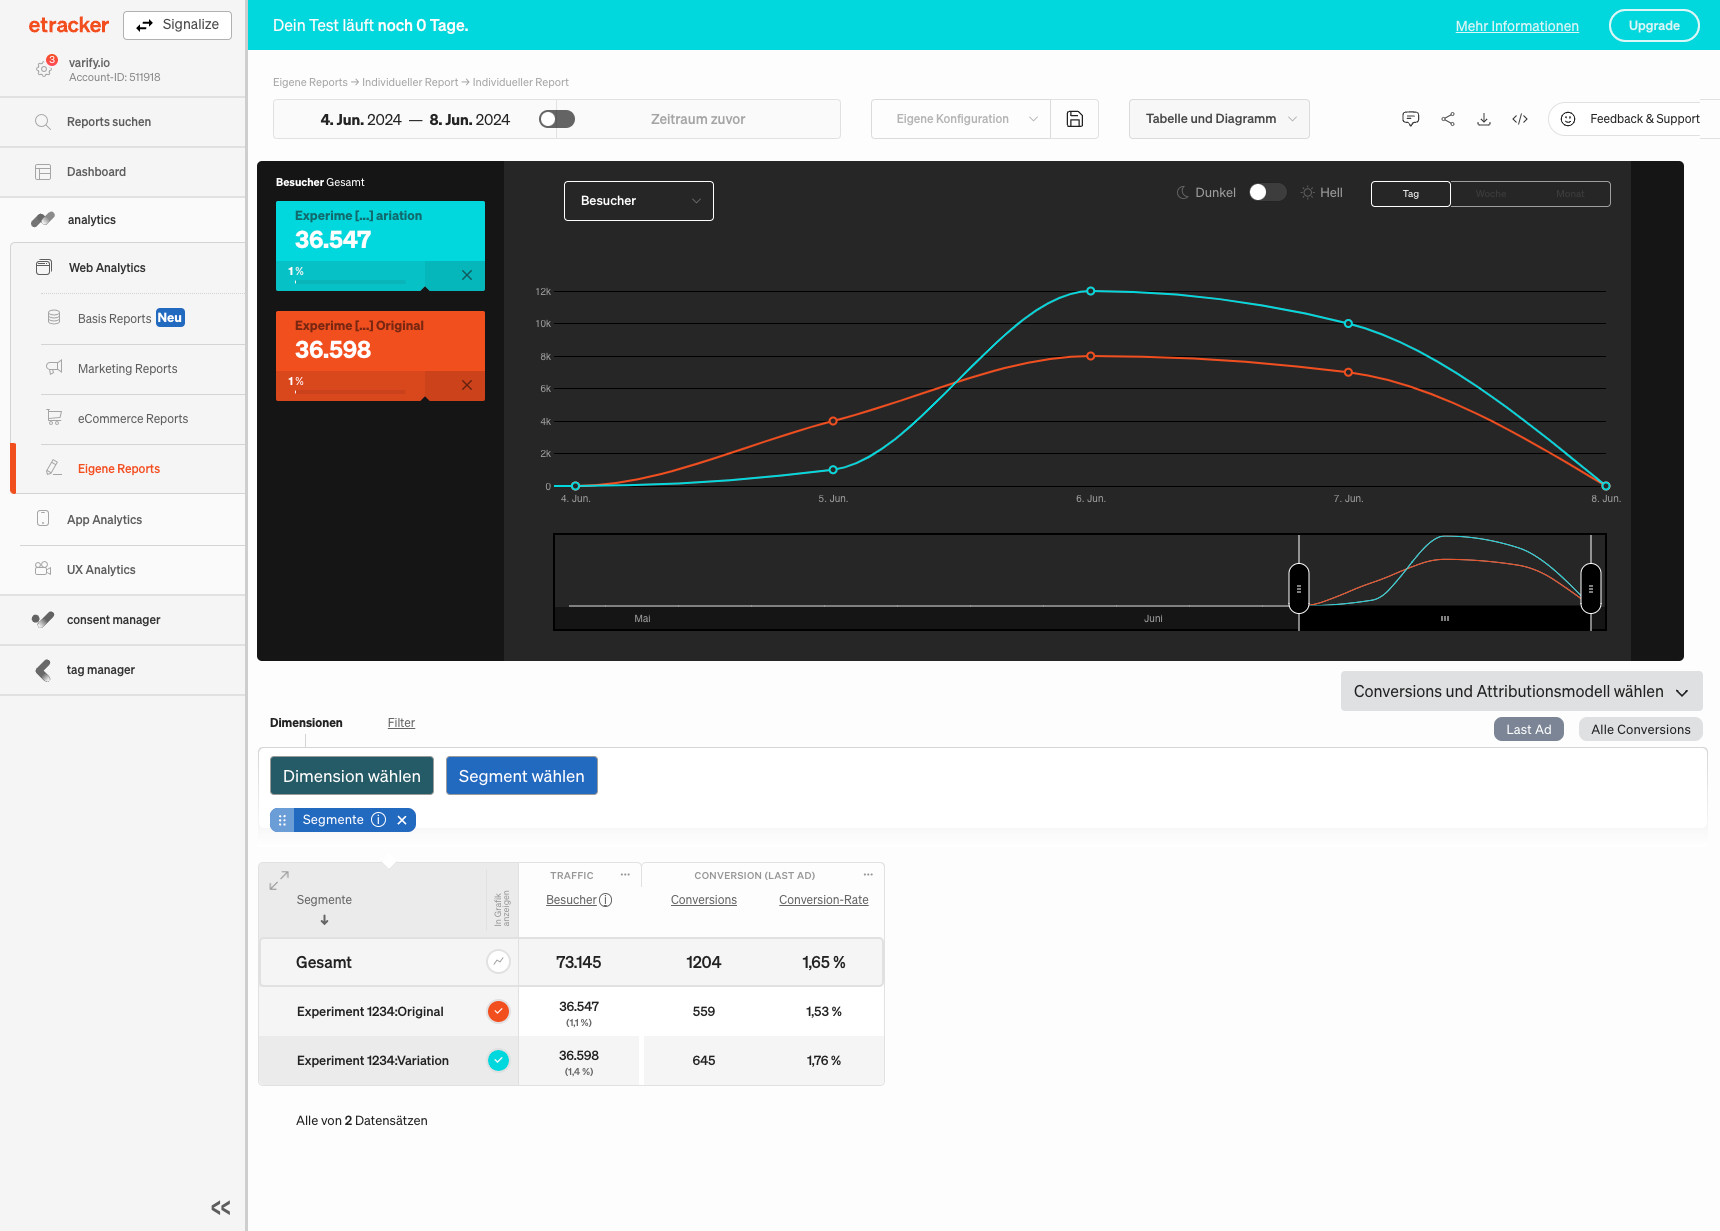
In etracker, the analysis is carried out using segments. Create an individual segment for each variant of your experiment. You can then add these segments to an existing report or configure a new report with customized key figures.
etracker integration
If you have not yet completed the tracking integration for etracker, you should do this first. You can only evaluate experiment data in etracker once you have set up tracking.
Evaluate experiments in etracker
1. create segments
To evaluate your experiments, it is first necessary to create a separate segment for each variant. This segment is then added to your report.
- Under „Web Analytics,“ go to „Custom Reports“ and then select „Custom Report.“.
- Then click on "Select segment" and then on "Create new segment".
- Now click „Add Segment +“ to create a segment.
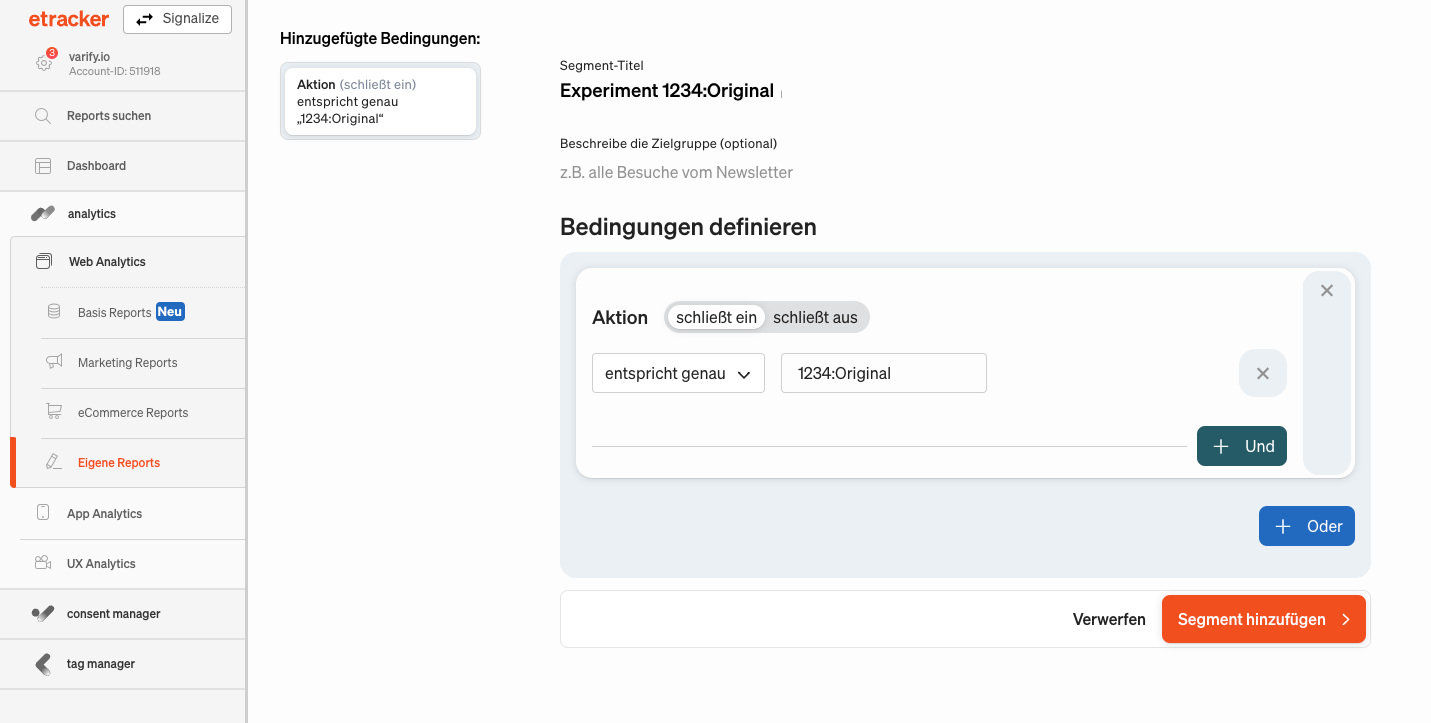
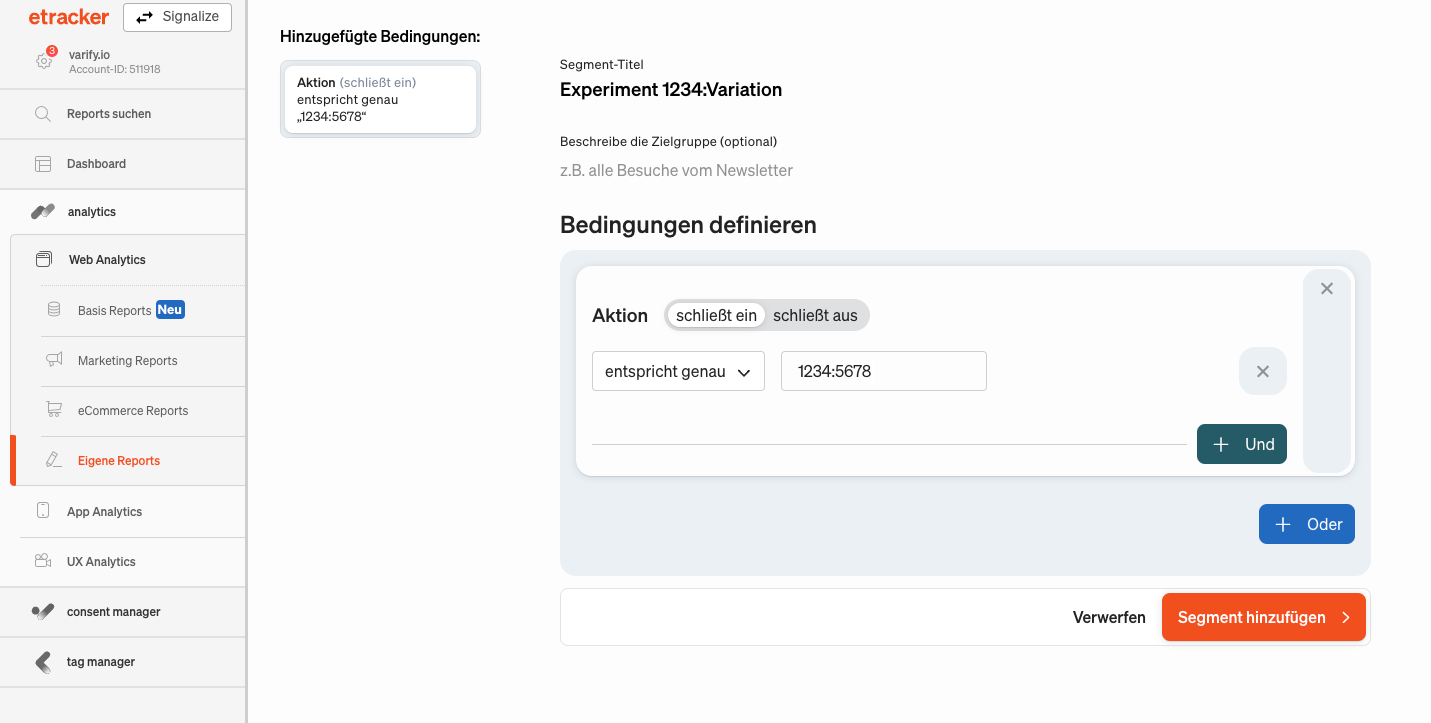
- Give the segment a clear title to make it easier to identify, e.g. with the experiment and variant IDs ("Experiment 1234: Original", "Experiment 1234: 5678").
- Click „Add Filter +“ and select „Action.“.
- Make sure the filter is set to „includes“ and „exactly matches.“.
- Now enter the correct IDs: „{Experiment ID}:{Variant ID}.“ Adjust the placeholders accordingly (e.g., „1234:Original,“ „1234:5678“).
- Save the segment by clicking „Add Segment“
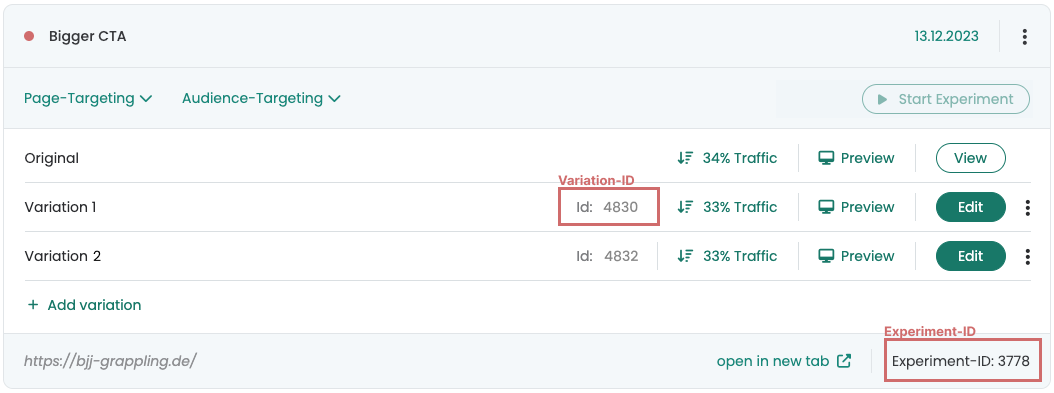
You can find the experiment and variant ID in Varify for each experiment created:
2. add segments in custom report
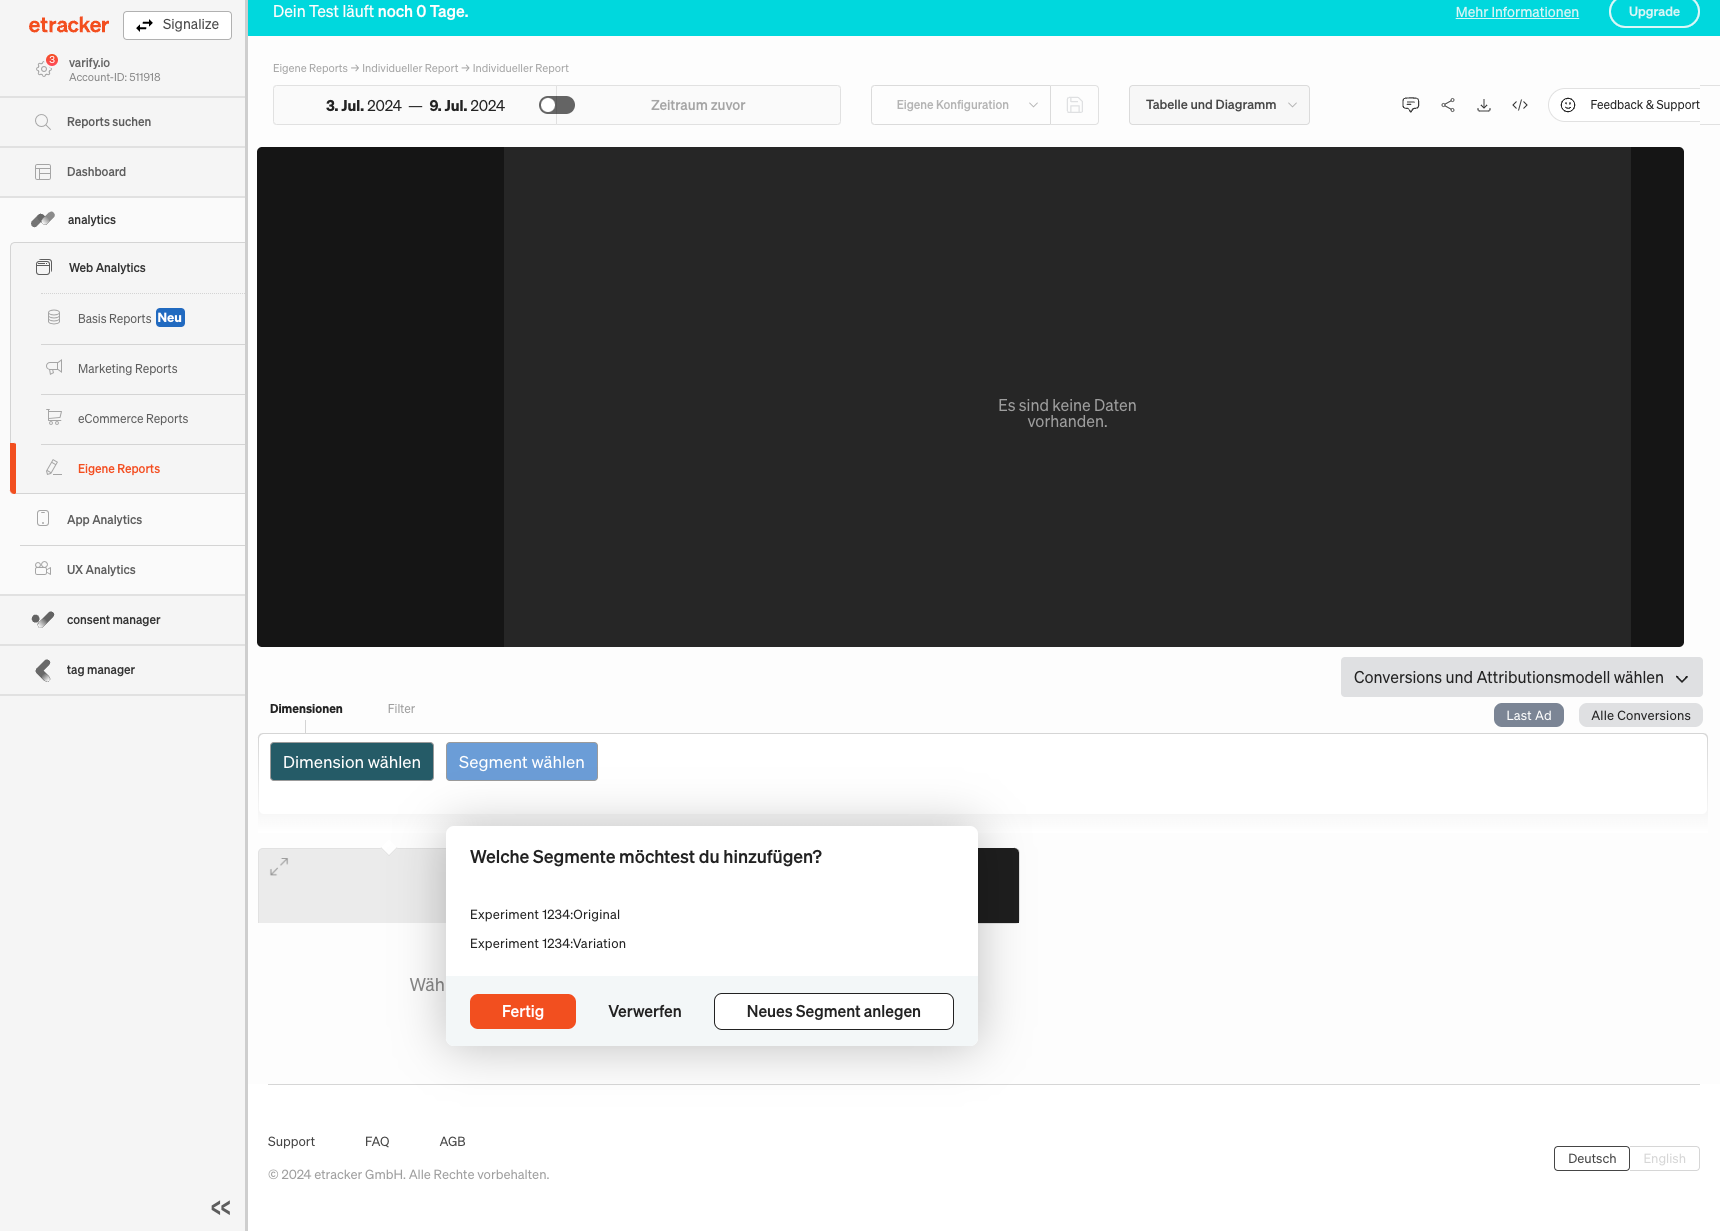
After you have created the segments, return to your own reports:
- Go to „Web Analytics > Custom Reports > Custom Report.“.
- Click „Select Segment“ again.
- Select the segments you have just created from the list.
- Click „Done.“.
The segments are now added to your report and ready for evaluation.
3. add metrics in custom report
Once you have added the segments to your report, the next step is to add the desired metrics to effectively analyze the experiment. Here are the steps to do this:
- Click „Add Metrics and Metric Groups.“.
- Now select the key figures that should appear in your report. It is important that you select at least the "Visitors" key figure in order to be able to determine the number of visitors in each variant.
A typical report could include the following key figures, for example:
- Visitors: Shows the total number of visitors for each variant.
- Conversions: Records the number of visitors who have completed a desired action.
- Conversion rate: Calculates the ratio of conversions to total visitors to measure the effectiveness of each variant.
Make sure that you select all relevant metrics to perform a comprehensive analysis of your experiment.